Summary
The Elcano Global Presence Index is a tool for analysing international relations created by the Elcano Royal Institute and first published in 2011. This paper collects the updated methodology of this composite index and explains the numerous methodological changes since its creation.
First, it presents the objectives and relevance of the Index, in addition to a brief historical overview. Secondly, it recalls its possible uses, as well as the criteria for selecting countries and variables. Next, it details the contents of each of its three dimensions –economic, military and soft–, followed by an explanation of the aggregation method of the Index’s components. The paper ends with the explanation of other statistical elements of the Elcano Global Presence Index (normalisation of values, missing cases or treatment of outliers).
The aim of this paper is to bring together in a single document the detailed and updated methodology of the Index (until now dispersed) in all its aspects: from its relevance to its mathematical formulation.
Introduction
In 2008 the idea arose of creating a tool at the Elcano Royal Institute to quantify the international positioning of countries in the complex, changing and somewhat confusing post-Cold War world. At that time there were already many exercises that tried to synthesise the international context through quantification. However, most of them did so adopting a partial view, still partly anchored in the nature of international relations during the years of the Berlin Wall, limited to the military dimension or to economic power.[1]
The Elcano Global Presence Index was created with the aim of facilitating the understanding of the international context in two ways. On the one hand, it seeks to capture international exchanges in their entirety (economic and military, but also cultural, technological, scientific and migratory). On the other hand, it expressly seeks to move away from the measurement of power. The quest for regional or global influence may have been a feature of the foreign policy of the great powers (and of the medium-sized ones) during much of the second half of the 20th century. However, in the transition to the 21st century, in the context of an accelerating globalisation process, a good number of countries are adopting measures of openness and outward projection without necessarily seeking to exercise power.
That is, in these years, countries are increasingly present in the international sphere at a growing number of levels (from the economy to sports), regardless of whether their presence may eventually make them more influential. And that is the reality that the Index aims to capture, synthesise and quantify. Thus, 2011 saw the first edition of the Elcano Global Presence Index, which classified 52 countries according to their projection in the fields of economy, defence, migration and tourism, culture and science, and development cooperation (Olivié & Molina, 2011).
Since its creation, the Index has undergone several methodological changes of varying degrees of importance. In its second edition, the Index re-classified the projection areas in the three economic, military and soft dimensions (Olivié & Gracia, 2013). Within each of these dimensions, several variables were methodologically reworked. The idea was to improve the robustness and coherence with the concept of global presence and/or to update the measurement to the changing characteristics of international relations. These are the cases of the variables of military equipment (Olivié & Molina, 2012), information (Badillo & Gracia, 2015), technology (Álvarez, Natera & Marín, 2019), sports (Martínez Hermosilla, 2020) and culture (Badillo, 2020). It is also the reason why in the 2022 edition a climate-change variable was incorporated into the soft dimension (Escribano et al., 2023).
Likewise, between 2016 and 2017 the Index was revised by the Composite Indicators (COIN) team of the Joint Research Centre (JRC), based in Ispra, under the European Commission. The changes made to the calculation method (treatment of variables and outlier cases, mainly) improved its statistical robustness (Domínguez-Torreiro, Álvarez-Díaz & Saisana, 2017).
In terms of geographical scope, with each new edition additional countries have been added to the Index calculation (generally based on the size of their economies in terms of GDP) up to the current 150 countries now included that, according to World Bank data, account for more than 98% of the world’s economy and population. Moreover, since its third edition, the Index has also been calculated for the EU as if it were a single country, which is achieved, in essence, by adding the international presence of the member States and subtracting intra-European exchanges. The focus on the EU has also led to the creation of the Elcano European Presence Index, which instead quantifies the projection of member States in the European sphere (Olivié & Gracia, 2013).
The changes also affect the system for obtaining, and the specific values of, the weighting coefficients for aggregating the variables and dimensions. The current coefficients are the result of triennial surveys with international experts from more than 100 think tanks of all geographical areas of the world. In this way, the aim is to minimise temporal and geographical biases in the weight assigned to each area of international relations (Olivié & Gracia, 2016; Gracia, Olivié & Santana, 2019; Gracia, Mantecón & Olivié, 2022).
Other methodological developments have consisted of calculating the geographic distribution of global presence for some regions or countries. Specifically, this exercise has been done for the EU (Olivié & Gracia, 2020b), Spain and Portugal (Olivié, Gracia & Ribeiro, 2022). In addition, in the case of the EU and Spain, the internal geographical origin of the external presence is also calculated, by Autonomous Community (ie, by region) in Spain’s case (Olivié, Gracia & Díaz, 2016) and by member State in the EU’s (Olivié & Gracia, 2020b).Definition, objectives and approach
The Elcano Global Presence Index calculates the projection of countries outside their borders, in the economic (energy, primary goods, manufacturing, services and investment), military (troops and military equipment) and soft (migration, tourism, sports, culture, information, technology, science, education, development cooperation and climate change) dimensions (see Figure 1).
Figure 1. Elcano Global Presence Index
In this way, the Index facilitates, on the one hand, the analysis of international relations, foreign policy and global affairs, showing the volume and nature (economic, military or soft) of a country’s external projection, as well as its evolution, either individually or in comparison with those of other countries or regions. The Index thus contributes to understanding the regional and global role of each of the 150 countries for which it is calculated, of the EU, or of groupings of countries.
On the other hand, given the high representativeness of the 150 countries included in terms of GDP and world population, the Elcano Global Presence Index allows the study of the process of (de)globalisation since 1990 and its changing nature (Olivié & Gracia, 2020a and 2021).
Geographical and time scope
The Index is currently calculated for 150 countries chosen broadly based on the size of their economies (in current currency units) according to World Bank data (Figure 2).
Figure 2. Countries included in the Elcano Global Presence Index
| Afghanistan | Dominican Republic | Lithuania | Saudi Arabia |
| Albania | Ecuador | Luxembourg | Senegal |
| Algeria | Egypt | Madagascar | Serbia |
| Angola | El Salvador | Malawi | Singapore |
| Argentina | Equatorial Guinea | Malaysia | Slovakia |
| Armenia | Estonia | Mali | Slovenia |
| Australia | Ethiopia | Malta | Somalia |
| Austria | Finland | Mauritania | South Africa |
| Azerbaijan | France | Mauritius | South Korea |
| Bahamas | Gabon | Mexico | South Sudan |
| Bahrain | Georgia | Moldova, Rep. of | Spain |
| Bangladesh | Germany | Mongolia | Sri Lanka |
| Belarus | Ghana | Morocco | Sudan |
| Belgium | Greece | Mozambique | Sweden |
| Benin | Guatemala | Myanmar | Switzerland |
| Bolivia | Guinea | Namibia | Syrian Arab Republic |
| Bosnia-Herzegovina | Haiti | Nepal | Tajikistan |
| Botswana | Honduras | Netherlands | Tanzania |
| Brazil | Hungary | New Zealand | Thailand |
| Brunei Darussalam | Iceland | Nicaragua | Togo |
| Bulgaria | India | Niger | Trinidad & Tobago |
| Burkina Faso | Indonesia | Nigeria | Tunisia |
| Burundi | Iran | North Macedonia | Turkey |
| Cambodia | Iraq | Norway | Turkmenistan |
| Cameroon | Ireland | Oman | Uganda |
| Canada | Israel | Pakistan | Ukraine |
| Chad | Italy | Panama | United Arab Emirates |
| Chile | Jamaica | Papua New Guinea | UK |
| China | Japan | Paraguay | US |
| Colombia | Jordan | Peru | Uruguay |
| Costa Rica | Kazakhstan | Philippines | Uzbekistan |
| Cote D’Ivoire | Kenya | Poland | Venezuela |
| Croatia | Kuwait | Portugal | Vietnam |
| Cuba | Kyrgyzstan | Qatar | Yemen |
| Cyprus | Lao People’s Dem. Rep. | Republic of the Congo | Zambia |
| Czech Republic | Latvia | Romania | Zimbabwe |
| Dem. Rep. Congo | Lebanon | Russia | |
| Denmark | Libya | Rwanda |
In addition to the possibility of analysing globalisation, the inclusion of a large number of countries allows for a wide international comparison. The way to facilitate temporal comparison is by calculating the Index over a relatively long period of time (while maintaining the methodological criteria so that such a comparison is feasible). Thus, the first Elcano Global Presence Index data are for 1990. For the period 1990-2010, given the scarcity of data in the sources consulted, it is not possible to construct an annual series for all the indicators, but it is possible to construct a five-year series, which leads to the collection of Index results for the years 1990, 1995, 2000, 2005 and 2010 and, from that year onwards, annually up to the present day. In this respect, the intention of the project is to show the world of the two blocs, albeit in its twilight, and its evolution since then.
Thus, the 1990 values for Russia refer to those of the Soviet Union, for Germany to the Federal Republic of Germany, for the Czech Republic to Czechoslovakia and for Serbia to Yugoslavia. In addition, the countries of Eastern Europe and Central Asia that became independent after 1990 have no value assigned for that year. This is the case for Armenia, Azerbaijan, Belarus, Estonia, Georgia, Latvia, Lithuania, Kazakhstan, Kyrgyzstan, Moldova, Tajikistan, Turkmenistan, Ukraine and Uzbekistan as part of the Soviet Union, for Slovakia as part of Czechoslovakia and for Bosnia-Herzegovina, Croatia, North Macedonia and Slovenia as part of Yugoslavia. South Sudan has also been registered since 2012 following its independence.
As with other international databases, it is possible to aggregate data from different countries to form geographical regions (as shown in Figure 3) or other aggregations (OECD, NATO, G7 or G20).
Figure 3. Regional groupings in the Elcano Global Presence Index
| Asia-Pacific | Afghanistan, Australia, Bangladesh, Brunei Darussalam, Cambodia, China, India, Indonesia, Japan, Kazakhstan, Kyrgyzstan, Lao People’s Democratic Republic, Malaysia, Mongolia, Myanmar, Nepal, New Zealand, Pakistan, Papua New Guinea, Philippines, Singapore, South Korea, Sri Lanka, Thailand, Tajikistan, Turkmenistan, Uzbekistan & Vietnam |
| Europe | Albania, Armenia, Azerbaijan, Belarus, Belgium, Bosnia-Herzegovina, Brunei Darussalam, Bulgaria, Croatia, Cyprus, Czech Republic, Denmark, Estonia, Finland, France, Germany, Georgia, Greece, Iceland, Ireland, Italy, Lao People’s Democratic Republic, Latvia, Lithuania, Luxembourg, Malta, Moldova, Netherlands, North Macedonia, Norway, Poland, Portugal, Romania, Russia, Serbia, Slovakia, Slovenia, Spain, Sweden, Switzerland, Turkey, Ukraine & the UK |
| Latin America | Argentina, Bahamas, Bolivia, Brazil, Chile, Colombia, Costa Rica, Cuba, Dominican Republic, Ecuador, El Salvador, Guatemala, Honduras, Jamaica, Mexico, Nicaragua, Panama, Paraguay, Peru, Trinidad and Tobago, Uruguay & Venezuela |
| Maghreb & Middle East | Algeria, Bahrain, Brunei Darussalam, Egypt, Iraq, Israel, Jordan, Kuwait, Lebanon, Libya, Mauritania, Morocco, Oman, Qatar, Saudi Arabia, Syrian Arab Republic, Tunisia, United Arab Emirates & Yemen |
| North America | US & Canada |
| Sub-Saharan Africa | Angola, Benin, Botswana, Burkina Faso, Burundi, Cameroon, Chad, Cote D’Ivoire, Democratic Republic of the Congo, Ethiopia, Equatorial Guinea, Gabon, Ghana, Guinea, Kenya, Malawi, Mali, Mauritius, Mozambique, Namibia, Niger, Nigeria, Republic of the Congo, Rwanda, Senegal, Somalia, South Africa, Sudan, South Sudan, Tanzania, Togo, Uganda, Zambia & Zimbabwe |
In addition, since 2012 the Elcano Global Presence Index has also been calculated for the EU. This exercise attempts to quantify the global projection of the Union as if it were a hypothetic state with its own identity. The first year for which the EU’s global presence is measured is 2005. Moreover, we have considered, as for the other institutional aggregates (NATO and the African Union, for example) the variable composition of the Union over the years. Thus, the EU’s overall presence changes with each new enlargement. Consequently, its record of presence corresponds to that of its 25 members in 2005, 27 between 2010 and 2012, 28 between 2013 and 2021, and again 27 from 2021, following Brexit.
As shown below, for the measurement of the EU’s presence in the world we maintain the same variables as for the rest of the countries for which the Elcano Global Presence Index is calculated. In each of these variables, and for each European country, it is necessary to differentiate between intra- and extra-EU exchanges, since the mere aggregation of results for each member state would also be considering the projection of each country in other State/s of the Union (take, for example, intra- and extra-European trade in German goods). This distinction has been made possible by resorting to data sources other than those used for the Elcano Global Presence Index and particularly Eurostat.
Selection of variables
Following the definition and objectives set for the Index, several criteria guide the selection of the variables that make up the economic, military and soft dimensions.
Unidirectionality
For each variable, the taken indicator shows the country’s relationship with the outside world in only one of the input or output directions. For example, foreign trade presence is through exports (and not imports); investment, through the stock of capital abroad (and not domestic); and defence, through troops deployed abroad (and not foreign troops present in a nation’s territory). In each case, we choose the direction that we consider best reflects the country’s projection abroad and avoid counting both directions, which would reflect, in our opinion, external openness rather than presence.
Results versus means
The variables chosen reflect results, as opposed to instruments, whenever possible. Thus, for example, a country’s trade presence is measured through its exports, but not through the means employed to promote them (export credits, participation in trade fairs, trade missions, number of diplomats or officials dedicated to foreign promotion, membership of customs unions or trade agreements, etc). In this way, the intention is to reinforce one of the Index’s uses, which is as a tool for foreign policy analysis: it makes it possible to compare the results of foreign action (included in the Index) with the means used to promote them.
Transnational dimension
The variables included reflect cross-border action. In other words, economic flows of a trade nature or migration are included, but not GDP or population. In this respect, we do not consider data on countries’ assets, not even on potentially tradable assets. Thus, for example, variables such as biodiversity, gastronomic offerings, oil reserves or the number of world heritage monuments that, although they may lead to a greater presence abroad will not do so automatically, are not included. Following the same examples, global presence in these areas would be translated into a greater inflow of tourists or a higher volume of exports, indicators that are considered in soft and economic dimensions of the Index.
Descriptive, non-normative approach
It is worth noting the instrumental nature of the tool, non-normative, which also sets the criteria for the selection of variables. The indicators are intended to serve as a basis for analysing countries’ external action and the globalisation process, but the Index does not in itself constitute a value judgment. For example, exports of technological products are not considered preferable to traditional ones, or the soft versus the military dimension, or United Nations military missions versus others.
Comprehensive but synthetic index
In addition to other statistical considerations explained below, the Index seeks to capture the reality of contemporary international relations in all their complexity, while using as few indicators as possible. Consequently, on the one hand, indicators are selected to explain global exchanges for the whole world, which excludes, for example, Michelin stars or Nobel prizes as forms of cultural or scientific presence. On the other hand, we try to synthesise the most representative forms of presence, which excludes, for example, many international sports competitions.
Economic presence
In the economic dimension, external presence is measured through primary goods, energy, manufacturing, services and investments. All variables are expressed in monetary units and, specifically, in current US dollars, as are other indicators in other areas. The data source is the same for all variables in the economic dimension, namely UNCTAD.
Energy
Energy presence is summarised in fuel exports, which UNCTAD considers primary goods treated as a source of energy (section 3 of the Standard International Trade Classification). It was decided to disaggregate energy trade from general trade in raw materials because of the differentiated global presence that energy trade provides compared with trade in any other type of good or service. Thus, for example, it is being assumed that the global presence of oil exporting countries is different from that which can be registered through, for example, the massive export of coffee (another raw material) or of manufactured goods or banking services.
Primary goods
This variable comprises exports of primary goods, excluding energy products and including food, beverages, tobacco, agricultural products, non-ferrous metals, pearls, precious stones and non-monetary gold (sections 0, 1, 2, and 4 of the Standard International Trade Classification, with the addition of chapters 68, 667 and 971).
Manufactures
Manufactures include chemical products, machinery, transport equipment and, in short, all exported goods that do not fall under the primary goods or energy variables (sections 5, 6, 7 and 8 of the Standard International Trade Classification, excluding chapters 68 and 667).
Services
The services variable is composed of exports in transport, construction, insurance, financial services, information technology, media, intellectual property, other business services, personal, cultural and leisure services, and public services. Here we also seek to differentiate the international profile of economies with a marked tertiary character, as for example is the case of Spain, where the behaviour of this variable is also linked to that of the tourism variable in the soft dimension.
Investments
The investment variable is measured with the stock of foreign direct investment (FDI) abroad. Thus, opting for the stock rather than the flow, the indicator reflects the accumulated presence abroad over time, showing relationships of stable duration and with a stronger link to the terms of trade insertion.
In the debates about the methodology that took place between 2008 and 2011, other variables were considered for inclusion in the economic dimension (transnational companies, portfolio investment and trade volume, for instance). The reasons why they were rejected are explained in greater detail in Olivié & Molina (2011).
Military presence
Military presence is made up of two variables: troops deployed abroad, either on specific missions or on bases, and the military equipment that may be considered necessary for such a deployment. The source used for all data in this area is The Military Balance Report, produced by the International Institute for Strategic Studies (IISS).
Troops
This includes the total number of troops deployed (military personnel deployed in international missions) in any country except the one analysed, regardless of the nature of the mission. Perhaps the optimum would have been to take the deployable troops, which for a given year and a given country may be much higher than those deployed. However, given the impossibility of collecting these data, we opted for the second optimum of deployed troops.
Military equipment
To measure deployment capacity –which is a dimension certainly difficult to capture empirically in a single indicator– we consider the number of strategic transport systems of different classes: aircraft carriers, frigates, cruisers, destroyers, nuclear-powered submarines, amphibious projection ships, medium and heavy strategic transport aircraft, and tanker aircraft. It is understood that only with different means allowing strategic mobility is it possible to acquire the capacity of intervention in international missions, which is what gives a country a global presence.
For this variable, it is necessary to determine the weight that each of the means will have in the aggregation. Not doing so would imply assuming that an aircraft carrier provides the same capability as a frigate. The calculation of proportional weights explained below is assuming that countries are rational actors and that they seek, in the distribution of the budget when acquiring means, to optimise their military deployment capabilities. In order to determine the weight of each military means, we obtained their equivalence on a scale where the total amount of the different types of equipment registered by the 150 countries in 2010 adds up to 1,000. Thus, the total number of aircraft carriers in the world would provide an external presence equivalent to that of the total number of frigates. In 2010, as the number of frigates was 17.3 times the number of aircraft carriers, each aircraft carrier would represent a presence of approximately 17 frigates. According to this method of calculation, the weighting coefficient for each type of equipment is as follows (on a scale of 0-1,000): aircraft carriers, 390.7 units; amphibious ships, 150.8; frigates, 22.6; destroyers, 43.0; cruisers, 307.0; nuclear submarines, 62.7; strategic transport aircraft, 5.0; and tanker aircraft, 18.3.
Soft presence
Following the approach behind Nye’s (1990) conceptualisation of soft power, this dimension seeks to capture a sphere of international relations which, as the Index results for the last three decades show, has been gaining importance, even in periods of generalised demilitarisation or of economic contraction This is certainly a varied field, which has necessarily led us to incorporate a large number of variables, which are described below.
Again, as with the economic and military dimensions, the debates about which variables to include were complex and extensive. The rationale for the selection of these variables is explained extensively in Olivié & Molina (2011) as well as in all subsequent methodological developments cited at the beginning of this working paper.
Migrations
To measure the international presence in immigration, we select the estimated number of international migrants in each country at mid-year, provided by the United Nations Population Division on a five-yearly basis –and with renewal of the data in years that are multiples of five (2000, 2005, 2010)–. The United Nations definition of migrant is associated with the concept of habitual residence, that is, a person who changes his or her residence to another country is considered a migrant, so refugees or asylum seekers in transit to third countries are not considered. In this case, as in tourism or education variables, the criterion of unidirectionality is being applied in the sense of entry, considering that the projection of a country is expressed to a greater extent through attraction, following the original conceptualisation of softness in international relations.
Tourism
This measures, in thousands of persons, the number of tourist arrivals at the border provided by the statistical database of the United Nations World Tourism Organisation (UNWTO). In most cases, the information reflects the data for ‘non-resident tourists’ in the destination country, but also, exceptionally, the UNWTO provides the equivalent data for ‘non-resident visitors’, ‘non-resident tourists staying in hotels or similar establishments’ or ‘non-resident tourists staying in all types of establishments’, depending on the visa regulations required by the receiving country. In any case, this basically includes tourism activity in its most social or cultural aspect, avoiding the duplication that would be implied by counting tourism revenues, which are included in the services variable of the economic dimension.
Sports
To measure international presence in sports, we use the main world sporting event (the Summer Olympic Games) and the performance in the global sport par excellence (men’s and women’s professional soccer). In the case of the Olympic Games, we take the sum of the medals obtained in the most recent edition for each country, using the data of the International Olympic Committee (IOC), the points from the Fédération Internationale de Football Association (FIFA) world ranking, which ranks the various men’s and women’s senior national teams (assigning to the UK the points corresponding to England) and the world ranking of men’s club soccer published by the International Federation of Football History and Statistics (IFFHS). The combination between soccer and the Olympic Games is weighted according to their global relevance measured by television audiences. Given that the global audience of the Olympic Games is approximately three times the audience of the FIFA World Cup, the medal component weighs 75% versus 25% for the soccer component. In order to homogenise the different magnitudes, the number of medals or points of a country is considered over the world total of medals or points recorded in the same year.
Culture
Cultural presence abroad is summarised in exports of audio-visual and related services (film productions, radio and television programmes, and musical recordings) and cultural goods (antiques and works of art, photography, books, jewellery, newspapers, etc). Although this involves a certain duplication of information –since it would be partially considered in the services variable of the economic dimension–, this indicator reflects another, non-economic, kind of presence. The source used for audio-visual and related exports is the World Trade Organisation (WTO), while the source used for exports of cultural goods is UN COMTRADE.
Information
In a historical stage of digital globalisation, it is essential to try to collect the presence of countries in the information dimension. This is done by collecting the number of mentions of each country in the main news agencies of the world, considering that these are Associated Press, Reuters, AFP, DPA, ITAR-TASS, EFE, ANSA and Xinhua. To avoid possible over-reporting, the data imputed to the countries to which any of these agencies belong exclude the appearances in its own agency. That is, the data for Spain excludes mentions of the country in EFE, the data for China excludes entries in Xinhua. This is one of the few sources used by the Elcano Global Presence Index that does not offer the data openly. These are collected via the Factiva platform, for which the Elcano Royal Institute has a subscription.
This indicator is complemented by the Internet bandwidth indicator, measured in Mbps and offered by the International Telecommunication Union, as a way of reflecting the presence of countries in digital media.
The combination of these two indicators is done by dividing their weight equally, ie, 50% of a country’s score in the information indicator corresponds to its score in the agency mentions component and 50% to its score in the Internet component.
Technology
To measure the foreign presence of countries in technological issues, we count international patents, which shows the capacity for scientific-technical innovation. Specifically, we have considered the so-called foreign-oriented patents, ie, the set of related patent applications filed in one or more foreign countries to protect the same invention, considering the country of residence of the first-named applicant as the country of origin of the patent. Thus, only scientific-technical production with a clearly cross-border component is taken for the measurement of global presence. The source is the statistical database of the World Intellectual Property Organisation (WIPO Statistics Database).
As in the case of sports, culture, information and climate change, this indicator is complemented by another one, considering that to reflect international technology exchanges it is necessary to include the income received for the use of intellectual property, taking the International Monetary Fund (IMF) as a source.
The combination of these two indicators is made, as in the case of the information indicator, by considering an equivalent weight of both components. That is, a country’s record in the technology indicator is 50% explained by the patent component and 50% by the income received from the use of intellectual property.
Science
Related to technological projection is scientific projection. We seek to complement the previous variable with another that reflects the activity of universities, researchers and think tanks in the scientific field. The reason for this is that the generation of patents is generally linked to hard scientific research, not reflecting that of the social sciences and in the arts and humanities even though this is an important dimension of international relations.
To capture this, we use the indicator of the number of articles, notes and reviews published in the fields of the arts and humanities, social sciences and sciences published in academic journals, considering as such those indexed in the Clarivate Analytics Web of Knowledge. The data, which are not offered in open access, are supplied by the Spanish Federation of Science and Technology (FECYT) by virtue of the agreement signed for this purpose with the Elcano Royal Institute. For the imputation of scientific production to the selected countries, the place of affiliation of the main author is taken as a reference, assigning one record to each country of affiliation of the authors in the case of co-authorship.
Education
This variable complements the scientific and technological variables by incorporating the total number of foreign students enrolled in each of the selected countries. It includes students in all tertiary education programmes (both undergraduate and graduate), and all those taught in colleges, universities, technological institutes and polytechnics. The source for this indicator is the United Nations Educational, Scientific and Cultural Organisation (UNESCO).
Development cooperation
For this variable, given the impossibility of including an outcome indicator, it has been necessary to resort to an instrumental indicator. As already mentioned, insofar as the Elcano Global Presence Index aims to reflect a country’s global presence, regardless of the means used to achieve this presence, the optimum would be some type of data that would assess the presence achieved through development aid (presence at donor tables, in sectoral or national development strategies, for example). However, this information is not systematised in any international database, so we have opted for an instrumental indicator (specifically, budgetary), which is the total gross disbursement of Official Development Assistance (ODA), whether bilateral or multilateral, reimbursable or non-reimbursable.
The source of this data is the OECD, both for the member countries of the Development Assistance Committee (DAC) and for those for which the same organisation generates an estimate, even if they are not members. Here again the data are expressed in current US dollars.
Climate change
Recently, the Elcano Global Presence Index has incorporated a variable related to climate change. Specifically, we include the greenhouse gas emissions and the installed capacity for the generation of renewable energies.
Here, in addition to direct emissions of CO2, CH4, N2O and fluorinated gases (from activities such as energy production, industrial activity and transport), we are also considering emissions from changes in land use, given its status as a carbon sink that can store large quantities of CO2 as a result of photosynthesis and microbial activity. Therefore, deforestation or intensive agriculture, together with the direct gases associated with their own activity, also have the capacity to release gases previously stored in the soil by altering land use. These data are available in the CAIT Climate Data Explorer of the World Resources Institute (WRI), which offers free access to historical emissions records by country.
The boom, in recent years, in the production of renewable energies is significantly altering the relations between countries, including the relations between fossil-fuel producing and consuming countries. It is therefore appropriate to incorporate this phenomenon into the Elcano Global Presence Index. For this exercise, we consider all possible sources of energy (wind, solar, hydro, biomass and biogas, geothermal, tidal and wave) in aggregate. The data are taken from the International Renewable Energy Agency (IRENA), an intergovernmental agency devoted to energy transition. At the time of incorporating this indicator, we should bear in mind that the Index already has an indicator related to energy in its economic dimension. However, with this methodological change there is no overlap since the energy variable only includes non-renewable sources and, specifically, exports of oil and refined products, and gas.
The combination of these two components is done by giving each a 50% weight within the climate variable. That is, half of a country’s record in the climate change indicator will correspond to emissions and the other half to its installed renewable energy generation capacity.
The dimensions, variables, indicators and sources of the Elcano Global Presence Index are summarised in Figure 4. As noted above, the calculation of the Index for the EU, as if it were a single country, requires some changes in the sources used, which are described in Figure 5.
Figure 4. Variables, indicators and sources of the Elcano Global Presence Index
| Variable | Indicator | Source |
|---|---|---|
| Economic presence | ||
| Energy | Flow of exports of energy products (oil, refined products and gas) (SITC 3) | UNCTAD |
| Primary goods | Flow of exports of primary goods (food, beverages, tobacco, agricultural commodities, non-ferrous metals, pearls, precious stones and non-monetary gold), excluding oil (SITC 0 + 1 + 2 + 4 + 68 + 667+ 971) | |
| Manufactures | Flow of exports of manufactured goods (chemical products, machinery, transport equipment and other manufactured products) (SITC 5 to 8 minus 667 and 68) | |
| Services | Flow of exports of services in transport, construction, insurance, financial services, IT, the media, intellectual property, other business services, personal, cultural and leisure services, and public services | |
| Investments | Stock of foreign direct investment abroad | |
| Military presence | ||
| Troops | Number of military personnel deployed in international missions and bases overseas | IISS |
| Military Equipment | Weighted sum of aircraft carriers, big ships, destroyers, frigates, nuclear-powered submarines, amphibious ships, medium and heavy strategic aeroplanes, and air tankers | |
| Soft presence | ||
| Migration | Estimated number of international immigrants in the country at mid-year | United Nations Population Division |
| Tourism | Thousands of arrivals of non-resident tourists at borders | United Nations World Tourism Organisation (UNWTO) |
| Sports | Weighted sum of medals won at the summer Olympic Games, points of male and female national teams in the FIFA world ranking and points of male football clubs in the IFFHS | FIFA, IFFHS and IOC |
| Culture | Exports of audio-visual and related services (cinematographic productions, radio and television programme and musical recordings) and cultural goods (antiques and works of art, books, jewellery, newspapers, photography, etc) | WTO – International Trade Statistics & UN-COMTRADE |
| Information | Number of mentions in news of main international press agencies (Associated Press, Reuters, AFP, DPA, ITARTASS, EFE, ANSA, Xinhua) and Internet bandwidth (Mbps) | Factiva database & International Telecommunication Union |
| Technology | External income for the use of intellectual property and number of foreign-oriented patents (inter-related patent applications filed in one or more foreign countries to protect the same invention) | IMF and World Intellectual Property Organisation (WIPO) |
| Science | Number of articles, notes and reviews published in the fields of the arts and humanities, social sciences and sciences | Clarivate Analytics via FECYT |
| Education | Number of foreign students in tertiary education on national territory | UNESCO |
| Development cooperation | Total gross flows of official development aid or comparable data | OCDE |
| Climate change | Greenhouse gas emissions and installed capacity for renewable energy generation | WRI & IRENA |
| Scaling factors | ||
| Economy | Gross Domestic Product (GDP) at current prices in US$ | World Bank |
| Population | Number of inhabitants | World Bank |
Figure 5. Variables, indicators and sources of the Elcano Global Presence Index applied to the EU
| Variable | Indicator | Source |
|---|---|---|
| Economic presence | ||
| Energy | Extra-EU flows of exports of energy products (oil, refined products and gas) (SITC 3) | Eurostat |
| Primary goods | Extra-EU flows of exports of primary goods (food, beverages, tobacco, agricultural commodities, non-ferrous metals, pearls, precious stones and non-monetary gold), excluding oil (SITC 0 + 1 + 2 + 4 + 68 + 667+ 971) | |
| Manufactures | Extra-EU flows of exports of manufactured goods (chemical products, machinery, transport equipment and other manufactured products) (SITC 5 to 8 minus 667 and 68) | |
| Services | Extra-EU flows of exports of services in transport, construction, insurance, financial services, IT, the media, intellectual property, other business services, personal, cultural and leisure services, and public services. | |
| Investments | Stock of foreign direct investment outside the EU | |
| Military presence | ||
| Troops | Number of military personnel deployed in international missions and bases outside the EU | IISS |
| Military Equipment | Weighted sum of aircraft carriers, big ships, destroyers, frigates, nuclear-powered submarines, amphibious ships, medium and heavy strategic aeroplanes, and air tankers | |
| Soft presence | ||
| Migration | Estimated number of immigrants from outside the EU | Eurostat |
| Tourism | Thousands of arrivals of tourists from outside the EU | Eurostat |
| Sports | Weighted sum of medals won at the summer Olympic Games, points of male and female national teams in the FIFA world ranking and points of male football clubs in the IFFHS. Corrective variable: European audience at the World Cup Final and the opening ceremony of the Olympic Games | FIFA, IFFHS, IOC Kantar and Nielsen |
| Culture | Extra-EU exports of audio-visual and related services (cinematographic productions, radio and television programmes and musical recordings) and cultural goods (antiques and works of art, books, jewellery, newspapers, photography, etc) | Eurostat |
| Information | Number of mentions in news of main non-European international press agencies (Associated Press, ITARTASS and Xinhua) and Internet bandwidth (Mbps) | Factiva database & International Telecommunication Union |
| Technology | External income for the use of intellectual property and number of foreign-oriented patents (inter-related patent applications filed in one or more foreign countries to protect the same invention). Corrective variable: patents registered for each member state in other member States | Eurostat and World Intellectual Property Organisation (WIPO) |
| Science | Number of European articles, notes and reviews published in the fields of the arts and humanities, social sciences and sciences | Clarivate Analytics via FECYT |
| Education | Number of non-EU foreign students in tertiary education in the EU | Eurostat |
| Development cooperation | Total gross flows of official development aid or comparable data | OCDE |
| Climate change | Greenhouse gas emissions and installed capacity for renewable energy generation | WRI & IRENA |
| Scaling factors | ||
| Economy | Gross Domestic Product (GDP) at current prices in US$ | World Bank |
| Population | Number of inhabitants | World Bank |
5. Aggregation of variables and dimensions
After defining the concept of global presence, its dimensions and variables and identifying the indicators and sources for its calculation, the construction of this composite index requires the definition of the weighting coefficients of each variable and dimension. For this purpose, and after having been checked by the statistical audit in 2016 with the JRC, we use expert criteria.
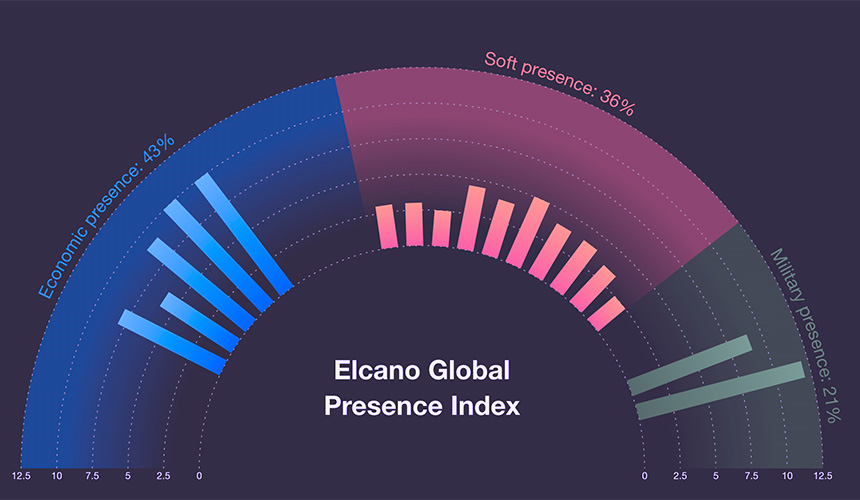
Specifically, every three years a survey is launched to more than 100 experts in international relations from centres located in all geographical areas of the world, asking them to assign a weight to each variable and dimension of the Index. The results of each new survey are aggregated with those of previous surveys so that, in this way we can reduce the geographical bias of the results (avoiding excessively Eurocentric views, for example) and the temporal bias (whereby responses may be conditioned by recent events such as, for instance, the invasion of Ukraine). The current coefficients, which incorporate the results of the 2021 survey, are shown in Figure 6.
Figure 6. Weighting coefficients of the Elcano Global Presence Index (in % of total)
| Economic presence 43 | Military presence 21 | Soft presence 36 |
|---|---|---|
| Energy 8 | Troops 9 | Migration 3.0 |
| Primary goods 6 | Military equipment 12 | Tourism 3.5 |
| Manufactures 9 | Sports 2.5 | |
| Services 10 | Culture 5.0 | |
| Investments 10 | Information 4.0 | |
| Technology 4.5 | ||
| Science 4.0 | ||
| Education 3.5 | ||
| Development cooperation 3.5 | ||
| Climate change 2.5 |
6. Other methodological issues
Once the variables of each indicator have been obtained from their respective sources, a series of steps are carried out until they are transformed into an index number, following the recommendations of the OECD manual (2008) of synthetic indexes, as well as the suggestions of the methodological audit made by the Joint Research Centre in 2016.
First, some variables do not provide data for all countries or years, so it is necessary to establish a criterion for obtaining the missing values to complete the dataset. This occurs mainly in the soft dimension, and particularly in the indicators of culture, tourism, education and development cooperation. In cases where there is a lack of information for some years but there are data for other ones, we calculate the average value (if there are data for the previous and subsequent years) or the last available value is repeated (if there are no data for subsequent years). The general criteria followed is that the estimation is made over the existing values of the series, and not with external data, and giving priority to the most recent information over that more distant in time. If there are no data in the whole series, the method followed has been the ‘expert criterion’, which determines the position that a country should occupy in the ranking of the indicator for which we want to obtain the value. In this case the estimation is not done on the raw data, but in terms of transformed value. In any case, the total number of estimates does not exceed 7% of the database.
Once the dataset is completed, we proceed to cleaning extreme values. For this purpose, we calculate the weight of the variables of the economic dimension over a country’s GDP, and the variables of the military and soft dimensions over its population. On these ‘named’ variables, values are cleaned according to kurtosis and asymmetry criteria, establishing maximum thresholds of 3.5 and 2, respectively. The extreme values detected are treated by ‘winsorisation’, which involves replacing the highest values to the immediately preceding ones until the skewness and kurtosis coefficients fall within the acceptable thresholds.
Once the database is clean of extreme values, it is normalised by the maximum-minimum method. Thus, each value is subtracted by the minimum value recorded in the data set of that variable and divided by the difference between the maximum and minimum value of the same set. This value is multiplied by 1,000, so that we obtain the normalised database for all indicators in the range 0-1,000.
Finally, the normalised dataset, performed on variables over GDP or population, is transformed into absolute values. For this purpose, the normalised indicators of the economic dimension are multiplied by the weight of the country’s GDP over the world average, and the normalised indicators of the military and soft dimensions by the weight of the country’s population over the world population average. Thus, the Index’s result takes into consideration the size of the country as a determining factor of its global presence volume.
7. Model
Considering all the elements described in the previous sections, the Elcano Global Presence Index model would be as follows:
Download the model in PDF format.
8. Bibliographic references
Álvarez, Isabel, José Miguel Natera & Raquel Marín (2019), ‘Indicadores de tecnología para medir la presencia global de un país’, ARI, nr 115/2019, Elcano Royal Institute, December.
Badillo, Ángel (2020), ‘La cultura en el “poder suave”: una revisión metodológica del Índice Elcano de Presencia Global’, Documento de trabajo, nr 21/2020, November, Elcano Royal Institute.
Badillo, Ángel & Manuel Gracia (2015), ‘Measuring soft presence. The case of news agencies’, in Olivié & Gracia (Coords.), Elcano Global Presence Report 2015, Elcano Royal Institute.
Domínguez-Toreiro, Marcos, Marcos Álvarez-Díaz & Michaela Saisana (2017), ‘Statistical audit of the Elcano Global Presence Index 2016, carried out by the Joint Research Centre (JRC)’, in Olivié & Gracia (Coords.) (2017), Elcano Global Presence Report 2017, Elcano Royal Institute.
Escribano, Gonzalo, Manuel Gracia, Lara Lázaro, Iliana Olivié & Ignacio Urbasos (2023), ‘Clima y globalización. Propuesta de inclusión de una variable de Cambio Climático en el Índice Elcano de Presencia Global’, ARI, nr 51/2023, Elcano Royal Institute, June.
Gracia, Manuel, Lucía Mantecón & Iliana Olivié (2022), ‘La percepción de las relaciones internacionales en tiempos de pandemia: encuesta de ponderación 2021 del Índice Elcano de Presencia Global’, ARI, nr 12/2022, Elcano Royal Institute, February.
Gracia, Manuel, Iliana Olivié & Néstor Santana (2019), ‘Un mundo, diferentes perspectivas: análisis de los resultados de la encuesta de ponderación 2018 del Índice Elcano de Presencia Global’, ARI, nr 7/2019, Elcano Royal Institute, January.
Martínez Hermosilla, Ginés (2020), ‘La globalización del deporte y el imperio del fútbol: revisando la proyección exterior’, Blog Elcano, Elcano Royal Institute, 13/IV/2020.
Nye, Joseph S. (1990), ‘Soft Power’, Foreign Policy, nr 80, Twentieth Anniversary (Autumn), p. 153-171.
OCDE (2008), Handbook on Constructing Composite Indicators: Methodology and User Guide, OECD Publishing, Paris.
Olivié, Iliana & Manuel Gracia (2013), Elcano Global Presence Report 2012, Elcano Royal Institute
Olivié, Iliana & Manuel Gracia (2016), Elcano Global Presence Report 2016, Elcano Royal Institute.
Olivié, Iliana & Manuel Gracia (2020a), ‘Is this the end of globalization (as we know it)?’, Globalizations, vol. 17, nr 6, p. 990-1007, DOI:10.1080/14747731.2020.1716923.
Olivié, Iliana & Manuel Gracia (2020b), ‘¿Regional or global player? The international profile of the EU’, Policy Paper, Elcano Royal Institute, July.
Olivié, Iliana & Manuel Gracia (2021), ‘Así impactó la pandemia en la globalización’ ARI, nr 94/2021, Elcano Royal Institute, November.
Olivié, Iliana, Manuel Gracia & Ignacio Díaz (2016), ‘La presencia global de España’ ARI, nr 67/2016, Elcano Royal Institute, September.
Olivié, Iliana, Manuel Gracia & Carola García-Calvo (2014), Elcano Global Presence Report 2014, Elcano Royal Institute.
Olivié, Iliana, Manuel Gracia & Ines M Ribeiro (2022), ‘España y Portugal en el mundo: análisis basado en el Índice Elcano de Presencia Global’, in Olivié, Rodrigues, Gracia & Seabra (Coords.), España y Portugal en la globalización. 500 años de la primera circunnavegación, Elcano Royal Institute, Centro de Estudos Internacionais do ISCTE-Instituto Universitário de Lisboa, Centro de Estudios Políticos y Constitucionales and Agencia Estatal Boletín Oficial del Estado, Madrid.
Olivié, Iliana & Ignacio Molina (2011), ‘Elcano Global Presence Index’, Estudios Elcano, nr 2, Elcano Royal Institute.
Olivié, Iliana & Ignacio Molina (Coord.) (2012), ‘Measuring the international presence of countries: the Elcano Institute’s IEPG Index methodology revisited’, Working Paper, nr 9/2012, Elcano Royal Institute, July.
[1] See Olivié & Molina (2011) and Olivié, Gracia & García-Calvo (2014).
Image: Graph of coefficients of the Elcano Global Presence Index. The Elcano Global Presence Index’s website.