The methodology employed for the Elcano Global Presence Index (IEPG) was published, alongside the results for 2010, more than a year ago.[1] Its publication and subsequent dissemination gave rise to various debates which, in turn, led to some rethinking of various elements of the Index’s methodology. Hence, the publication of the IEPG’s 2nd edition also entails some methodological changes which, nevertheless, alter neither its essence nor principles.
What is more, the growing debate about Spain’s international image has made even greater the need to understand what we might call its real and effective position in the world –which is what the IEPG attempts to measure– in relation to its image or reputation. Hence, the IEPG aims to be also a tool with which to understand all the variables and mechanisms involved in the ‘Spain brand’. It could be said that the differential between a country’s position in terms of image or reputation –its subjective presence– and the place it actually and effectively occupies –as reflected by the IEPG– is also a measure –if the differential is negative– of the efforts it might have to make to improve its image or to acquire a greater influence on the global stage, or –if the differential is positive– of the success of its public diplomacy, on which it has managed to capitalise to enhance its power, influence and/or image, having started from a more modest actual presence.
The main methodological changes have been as follows.
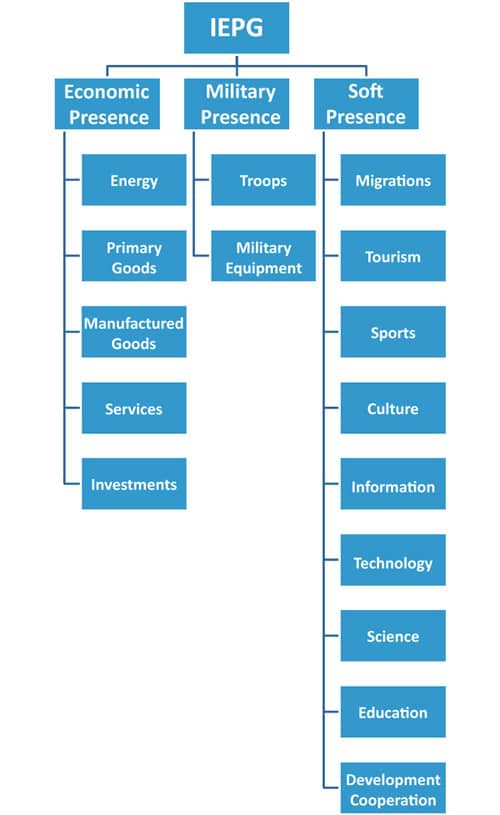
First, the global presence indicators have been regrouped in three areas –economic, military and ‘soft’–, instead of five. In any case, as shown below, the new weighting system for the IEPG, by indicators, allows for any combination of forms of presence, thereby making the simulator on the project’s web page easier to use.
Secondly, the deflator applied to the indicators expressed in monetary units has been eliminated. In this way, the use of overly laboured deflators is avoided, as they excessively depreciated the economic presence of European countries to the point that, for instance, they indicated that foreign trade had declined in real terms in almost all developed countries throughout the 90s. In this respect, it should also be pointed out that the Sports variable is ‘inflacted’, as explained below.
Third, the number of indicators that define Economic Presence has been increased, with Goods –the overall indicator in our initial methodology– being differentiated into Primary Goods and Manufactures. In these two cases, the nature of the presence provided by exports of one or the other type is different, thus making it easier to analyse Economic Presence in the IEPG.
Fourth, the sixth change is that the capacities covered by Military Equipment have been increased from the previous version’s focus on only the most strategic and long-range elements. This edition, in order to provide the Index with a greater internal consistency, now includes more short-range capacities, such as cross-border military projection. All of the Index’s other components assume that global presence also means cross-border presence, as in Migration, which makes no distinction between the countries of origin of migratory flows, and Services, which does not differentiate between the various export markets.
Fifth, a new Information indicator has been included in order to assess the ‘soft’ presence of countries via the Web. As explained below, installed bandwidth has been included as an element in the IEPG’s calculation.
Sixth, and finally, although the weighting system for the IEPG’s components –by polling experts– has been maintained, the survey has been extended to the IEPG’s two levels –areas and indicators–, thus allowing the reordering of the indicators into any presence grouping desired and not just into the three areas used in its current design. Similarly, the number of experts consulted has been increased and now includes a number from other countries in order to minimise any cultural bias that might emerge from being limited to domestic academics.
In addition to these methodological changes, we have provided this analytical tool with the platform that is best adapted to its nature as a synthetical index calculated for around 50 countries: a Website at www.iepg.es.
We have gone beyond the static character of the first IEPG, calculated for only one year, by taking a time series on a five-year basis to see how the global presence of countries has changed since the fall of the Berlin Wall. The IEPG data published in July 2012 for the years 1990, 1995, 2000, 2005, the re-calculation of the data for 2010 and this latest edition of 2012 all follow the methodology outlined below, instead of the one used for the initial Index’s results (Olivié & Molina, 2011). The provision of country files for the top 11 countries in the IEPG ranking also makes it easier to make an initial analysis of the time series.
A number of assumptions have had to be made to calculate the IEPG for 1990. As noted above, the object of including this year is to show the state of each country’s presence in the world at then end of the hegemony of the two rival power blocs. Hence, instead of including Germany, Russia, Estonia, Latvia, Lithuania, the Czech Republic, Slovakia and Slovenia, the 1990 IEPG comprises the Federal Republic of Germany, the Soviet Union, Czechoslovakia and Yugoslavia, although Estonia and Lithuania were actually formally independent by then. Although it was possible to collect data for most indicators for the four now extinct countries –all in the case of Economic Presence, Sports, Tourism, Education and Science–, others –Culture, Information and Technology– have had to be estimated by the authors. In the case of Migrations, it is the source itself, the United Nations Population Division, that calculated the estimated data for the new configuration and not for the old two bloc world. Hence, the Migration indicator for the Federal Republic of Germany in 1990 actually corresponds, according to the United Nations, to unified Germany –Federal Republic and the German Democratic Republic–, Yugoslavia’s to Slovenia, the Soviet Union’s to the aggregate for Russia, Estonia, Latvia and Lithuania and Czechoslovakia’s to the sum of the population stocks of the Czech Republic and Slovakia. In the case of development cooperation indicator, the figure for Germany is offered by the OECD -the original source for this country and not for the RFA- while the figure for the Soviet Union had to be estimated by the authors. Czechoslovakia and Yugoslavia have been assigned zero value for this indicator this year.
This Working Paper explains the methodology employed in calculating the IEPG. The first section goes over the IEPG’s definition and objectives, which remain unchanged from the earlier version. The following two sections respectively explain the criteria for selecting indicators and variables chosen to reflect the global presence of countries in economic, military and soft terms and for selecting countries. The fourth section describes the Index’s structure, its components and indicators and the sources for them. The final sections look at the most technical aspects (estimating missing data, limits of scale and weightings).
Definition and Objectives
By global presence we mean a country’s effective positioning, in absolute terms, in the economy, in society and in the global political and military arenas, all in the current context of globalisation.
Thus, the IEPG focuses on measuring the presence of various countries –and not their power or influence– in the fields of the economy, defence, and other spheres of soft presence such as culture, sports, tourism, migrations, science, information, technology, education and international development cooperation.
Measurements are based on objective and tangible data, not on opinion or perception. Similarly, the aim is not to measure a country’s level of insertion in the globalisation process or its degree of openness to it –something other globalisation and economic freedom indexes already do– but its total international presence or projection compared to other countries and with respect to its own history. Finally, it gauges a country’s presence by results, leaving aside any consideration of the efforts made achieve it, for instance, by joining supranational governance structures or by budgetary expenditure.
Additionally, by bringing together coherently the disperse quantitative information available on many aspects related to external projection and allowing comparisons between countries and over time, the Index is a very useful tool for any analysis related to the international presence of any country or selected group of countries. In the first place, with this Index, assessments can be made of any individual country’s foreign policy, and the Index can even help estimate a country’s positioning in terms of power or influence. For instance, a rise or decline in a country’s presence over time would give some idea of the efficiency of a given foreign policy implemented over a certain period of time. In this regard, it is not only future editions of the IEPG that will be useful but also retrospective analyses that illustrate the development of the countries included in the study. Secondly, the Index can help identify the main fields in which a country is present and the variations in the relative weight of its presence in different fields: an increase in the total presence of a country over a given period might coincide, for example, with a decline in its military presence, or a simultaneous rise in scientific or economic terms. This information would also help to identify the strategies employed by countries in the field of foreign affairs. Third, the IEPG makes it possible to analyse the global trends in international presence. Thus, it could be determined in general terms whether in recent decades the global presence of the group of countries included in the Index have increased their presence in development cooperation to a greater extent than in migrations. Finally, the IEPG also helps to analyse trends, in terms of global presence, for a selected group of countries. For instance, a combined analysis of the presence of China and the United States could help determine whether there is a trend towards a new bipolar world (along with its main features) and an analysis of Europe as a whole could likewise serve to identify trends in the global presence of Europe or the European Union.
In addition to the IEPG’s explanatory potential, its value can be multiplied by combining it –and the relative positions of countries it provides– with information from other already existing indexes. A comparative analysis of the IEPG’s values alongside those of indexes measuring competitiveness, globalisation, country image, GDP or per capita GDP, population, budgetary expenditure and others makes it possible to analyse foreign policy and international relations from a very large number of perspectives.
For instance, the Index can help determine when a country’s international presence exceeds its potential (understood as its economic or demographic weight). In order to do this, the value for each country and its position in the Index could be compared to its corresponding value in population and Gross Domestic Product. It would be possible for a country to box (in terms of presence) either above or below its weight (in terms of population or GDP), but also to box (in terms of final influence) above or below its weight (in terms of presence). For example, Brazil’s presence might be below its potential –as it has a limited degree of effective internationalisation considering the size of its economy–, but, conversely, it has done well in terms of influence, cashing in on its identification as an emerging BRIC country (Brazil, Russia, India and China), classing above its weight in terms of presence. In any case, what should be borne in mind is that the IEPG is based on objective data that measure a country’s effective internationalisation across several areas –not on subjective assessments of the importance assigned to certain powers, or on the effectiveness of converting it into real influence–. Regardless of the fact that the mid-term trend will very likely be the rise on the Index of emerging countries –while the Netherlands, Norway and Switzerland correspondingly decline –, the IEPG data provide interesting evidence that, in some cases, there is a significant contrast between great national potential and fledgling internationalisation. And the reverse can apply to small countries with an extraordinarily high level of overseas projection.
Criteria for Selecting Indicators and Variables
In line with the definition and objectives established for the IEPG, this section will explain the criteria guiding the selection of the indicators and variables that constitute the areas of global presence and therefore affect the final result of the IEPG for each country.
First, presence is measured in a single direction (what could be called unidirectionality). Secondly, it is presence results that are measured, not the means to achieve them. Furthermore, all variables have an explicitly outward character. Presence is given in absolute and not relative terms and the IEPG measures the quantity of presence and not its nature. Additionally, as with any other Index, the maximum explanatory effect is sought with the least number possible of indicators and variables. Finally, presence is assessed on the basis of hard data and not on opinions or perceptions.
Unidirectionality
One of the principles governing the IEPG is that, in each of the areas analysed, presence is measured in just one direction: as explained later on, foreign trade presence is defined through exports (not imports); investment presence is gauged in terms of capital outflows (not inflows); and defence is measured via military deployment abroad (not by the number of foreign troops or materiel present within a nation’s territory). The main reason is that in most cases, relations in both directions are to a greater extent the reflection of a country’s importance in the world, rather than of its foreign or global presence.
Results vs. Means
It should also be stressed that measuring presence implies the selection of indicators of results, not of means or instruments. Hence, a country’s commercial presence is gauged through its exports but not through the means invested in order to boost such a presence (e.g., export loans, participation in trade fairs, trade missions, number of diplomats and officials devoted to overseas promotion).[2] This selection of variables is consistent with the idea that the IEPG aims to serve as the basis for, among others, an analysis of the foreign policies of the countries chosen for the study. Indexes or analyses that resort to instrument variables to define the external presence of a country run the risk of a certain tautology: if a greater effort is made to enhance a country’s overseas presence (through means such as those mentioned above), and if the presence is measured through that same effort, it seems obvious that the result will be an increase in overseas presence. But this type of measurement says nothing about the results of the efforts. Going back to the earlier example, it is impossible to tell whether export loans or the participation in trade fairs (instrument variables) might actually have contributed to boosting exports (a result variable). This would only be possible by monitoring how exports develop (a result variable) and, depending on this result, by analysing the quality and quantity of the efforts carried out to increase the exports.
The Transnational Dimension
The IEPG only includes variables that contain specific information about the external or cross-border dimension of each case. The Index considers trade and financial flows, but not GDP (which, as stated, is a mere reference); it includes migration but not population (the other possible reference), and overseas military deployment –or the capacity for deployment– but not the available military force. The Index does not use data on countries’ internal assets, nor even of those that could potentially be made international. Rather, it is calculated using only explicit evidence of international presence. Thus, the Index does not feature variables such as a country’s biodiversity, gastronomy, oil reserves or the number of its monuments that have been declared United Nations world heritage sites, which might conceivably lead to a greater external presence, but do not automatically do so. However, in the case of these examples, global presence in such areas would be likely to lead to greater tourist inflows or larger export volumes, both of which are included in the IEPG.
Absolute and not Relative Presence
The working group responsible for designing the IEPG discussed at length whether it was appropriate to measure a country’s external presence in relation to its size (population or GDP). In the end, the group decided to regard presence in absolute terms and not, for instance, per capita, because the goal was to determine the global presence of a nation –not how open it is– and because (as stated in the previous section) it makes it easier to compare with its weight or potential, providing information on a country’s relatively greater or lesser vocation for establishing its international presence.[3]
Quantity as Opposed to Nature
In general terms, the Index’s components serve to measure the global presence of each country in quantitative and absolute terms, regardless of the nature of their presence. In the initial debates about the Index’s components, the possibility was raised of measuring both quantity and type of presence. Quantity refers to the degree to which one country is present in each of the areas –such as, or instance, the volume of its exports–, whereas to measure the type or nature of its presence it would be necessary to include elements of assessment similar to those needed to assess power or influence –for instance, exports of certain products might be considered better than others, because they might be the product of a more robust production model, in such a way that the exports of technologically complex products would be more highly regarded than those of labour-intensive ones such as low-cost tourism–.
The Index focuses on criteria involving quantity rather than nature or type, for the same reasons that it was decided to measure presence rather than power or influence. In the first place, introducing quality-based criteria would require assigning a value to the different natures of a single presence in each area –are exports of more technologically-oriented products better than exports of labour-intensive products?, are peacekeeping missions coordinated by the United Nations preferable to an international military presence that is decided bilaterally?–. This would lead inexorably to taking a subjective stance on the nature of an ideal presence, whereas the IEPG’s main aim is to serve as the basis for any kind of analysis of foreign policy or overseas presence, regardless of the approach from which the analysis is made. What is more, were it a matter of measuring the nature of an overseas presence, the Index would run up against a serious limitation which is the scarcity of data. Hence, the Index is made up of indicators which measure presence, regardless of whether it is of a bilateral or multilateral nature. For instance, a shift in a country’s foreign policy with regard to military issues –such as the US withdrawal from its bilateral military presence in Eastern Europe while increasing its presence by way of NATO– should not produce any variation whatsoever in the Index’s result for that country, if the shift does not entail an increase or decrease in its total military presence abroad.
Minimal Number of Indicators
The IEPG aims to take in as many possible forms of external presence with the smallest possible number of indicators. The idea is to gather the maximum information on different forms of presence with the minimum possible number of variables to ensure that the Index will have a greater elasticity to each of the indicators that comprise it. To this end, the study has attempted at all times to choose available indicators that illustrate in a more all-encompassing fashion the reality that the IEPG wants to depict. And each additional indicator or variable is justified only if the marginal added value can compensate for the complexity of including it. Similarly, the idea is to describe forms of presence that are appropriate for the entire set of countries selected. Possible indicators mentioned above, such as culinary reputation (which can be measured, for instance, through Michelin guide reviews) or the number of Nobel prizes won –aside from their greater or lesser transnational component– are forms of presence that would apply only to a small sub-set of countries like the United States, Japan, France and Spain, for instance. In other words, the aim has been to choose indicators that reflect variations in global presence for countries as disparate as the United States, Malaysia and Bulgaria.
Objective Data
Indicators such as culinary prestige or the number of Nobel prizes awarded, besides being representative variables for just a small group of developed countries, are indicators of perception (of presence of prestige, in this case) more than of objective presence. The IEPG always make use of objective or hard data (such as exports or troop deployment) and never subjective data or perceptions based on opinion polls or the opinions of experts.
Country Selection
The IEPG covers the global presence of a selection of 54 nations, including the 42 countries with the largest economies (in current terms, based on World Bank data from 2008)[4] as well as those that are not in this group but that belong to the Organisation for Economic Cooperation and Development (OECD) and/or the European Union. All of the G-20 member countries are represented in at least one of these two groups (Appendix 1).
Table 1. List of countries studied in the IEPG
| Argentina | Hungary | Norway |
| Australia | Iceland | Poland |
| Austria | India | Portugal |
| Belgium | Indonesia | Republic of Korea |
| Brazil | Iran | Rumania |
| Bulgaria | Ireland | Russian Federation |
| Canada | Israel | Saudi Arabia |
| Chile | Italy | Slovakia |
| China | Japan | Slovenia |
| Colombia | Latvia | South Africa |
| Cyprus | Lithuania | Spain |
| Czech Republic | Luxembourg | Sweden |
| Denmark | Malaysia | Switzerland |
| Estonia | Malta | Thailand |
| Finland | Mexico | Turkey |
| France | Netherlands | United Kingdom |
| Germany | New Zealand | United States of America |
| Greece | Nigeria | Venezuela |
Index Components[5]
The areas of external presence featured in the Index are Economic presence, Military presence and Soft presence. For each of these, a list of indicators has been chosen to reflect all the dimensions of external presence in each of these areas.
Economic Presence
In the area of Economy, external presence is measured through Energy, Primary goods, Manufactured goods, Services and Investments. Therefore, a country’s commercial presence is established via exports and it is understood also that splitting goods and services into these three categories provides important information about a country’s production and export profile which, ultimately, can be reflected in its presence abroad. All of the Economy variables are expressed in monetary units, as are other indicators in other areas
Energy
Energy presence is summed up in exports of fuels, specifically oil, refined products and gas.
It was decided to separate trade in energy from general trade in raw materials because of the different global presence it provides, as opposed to trade in any other kind of goods or services. The source for all export data is the UN, and more precisely the online database Comtrade.
Primary Goods
This variable is made up of exports of raw materials (excluding energy exports) and manufactured goods. Primary goods include food, beverages, tobacco, agricultural raw materials, ores, metals, precious stones and non-monetary gold.
Manufactured Goods
This covers the exports of manufactured goods –chemical products, machinery and transport equipment, and others– from the most labour intensive to the least, according to the UNCTAD’s product classification.[6]
Services
Trade in services comprises exports in transport, construction, insurance, financial services, information technology, the media, intellectual property, other business services, personal services, culture, entertainment and public services.
Investments
Investments are the stock of foreign direct investment (FDI). The indicator reflects the overseas presence accumulated through this type of investment. The source for FDI data is the UNCTADStat database.
Military Presence
The Defence area is made up of two indicators: Troops deployed and Military equipment. [7]
Troops
This is the sum of troops deployed (number of military personnel deployed in international missions) in any country except the one under analysis, regardless of the rank or nature of the mission.
Military Equipment
In order to measure a country’s capacity for military projection –which is difficult to aggregate empirically into just one indicator– this study follows the International Institute for Strategic Studies (IISS) model that includes aircraft carriers, cruisers, destroyers, frigates, nuclear submarines, large amphibious ships, medium and heavy strategic transport aircraft and tanker aircraft. It is understood that only the availability of this type of equipment expresses a country’s willingness to project itself regionally and globally, providing it with an objective capacity to establish a global presence, despite the impossibility of knowing the exact details of its troop and equipment deployments.
It is necessary to determine the weight of each item when defining the Equipment indicator. If not, the assumption would be that an aircraft carrier affords the same capability as a frigate. To determine their weight, an equivalence has been established on a scale in which the total quantity of the four classes is equal to 1,000, taking into account only the capabilities of the 54 countries of the IEPG that possess at least two of the four modes of military deployment under consideration. In this way, the total of aircraft carriers contributes an external presence that is equal to the total of frigates. As there are nearly 15 times as many frigates, each aircraft carrier would account for a presence of approximately 10 frigates. Under this method of calculation, the unit weight (out of 1,000) for each mode is as follows: aircraft carriers, 387 units; cruisers, 315; destroyers, 43; frigates, 25; nuclear submarines, 62; large amphibious ships, 150; medium and heavy strategic transport aircraft, five; and tanker aircraft, 13.
The source of the data is The Military Balance Report, produced annually by the IISS.
Soft Presence
Migrations
For international migration presence, the measurement chosen is the estimated number of international migrants at mid-year, as recorded by the United Nations Population Division every five years (2000, 2005 and 2010), of each of the countries selected for the Index.
Tourism
The Index measures the number of tourist arrivals at borders, as provided by the statistical database of the United Nations World Tourism Organization (UNWTO). In most cases, this information reflects data on ‘non-resident tourists’ in the country of destination, although the UNWTO also gives equivalent data on ‘non-resident visitors’, ‘non-resident tourists staying in hotels or similar establishments’ and ‘non-resident tourists staying in any kind of establishment’, depending on the visa regulations imposed by the host country.
Sports
In order to measure international sports presence, the Index uses the performance results of the various countries in men’s professional football, the most widely viewed global sport, along with data from the preeminent international sporting event, the summer Olympic Games.
In the case of football, the points from the world ranking of national men’s teams compiled by the Fédération International de Football Association (FIFA) are used. As it is updated every two months, the IEPG uses the version issued in December of the previous year. Also, the points corresponding to England are assigned to the United Kingdom. For the Olympic Games, the Index uses the results provided by the various national committees, which report total medals won in the most recent edition of the Games.
In order to combine the results of football and Olympic Games, the weighting was made according to the criterion of the global importance of the two components as measured by television ratings. According to FIFA and the Nielsen ratings agency, 2 billion viewers watched the opening ceremony of the most recent Olympic Games, while 700 million saw the final game of the last World Cup –peak viewing times for each event–. Thus, the football data are weighted at 25% and the Olympics at 75%. Although the Olympics data are updated only every four years, the IEPG sports indicator will still register annual variations through changes in the FIFA rankings, which account for 25% of the variable.
Culture
Cultural outreach not involving sports can be summarised in exports of audiovisual services. The source used for audiovisual exports data is the World Trade Organisation (WTO), which defines this area as film productions, radio and television programmes, and musical recordings. The data have been taken from the most recent edition of International Trade Statistics, with additional data (for instance, the breakdown for EU countries) provided specifically for the IEPG by the WTO.
Information
A country’s international information presence is gauged by the Internet, which includes the projection abroad of ideas originating in each country as expressed through the access from abroad to its national institutions, political organisations, the media, educational institutions, companies and civil society associations and networks. To measure it, and in the absence of any more precise indicator, the Index uses the bandwidth capacity contracted for each country for connections implying Internet traffic with other countries (International Internet Bandwidth).
Contracted capacity is calculated in units of information (megabits) and, although this does not exactly reflect actual traffic, countries tend to install and pay for the capacity they actually require. Nevertheless, the hub effect of some countries, such as Spain and the Netherlands, should not be underestimated.
The date used by the IEPG’s are from the annual statistical database published by the International Telecommunication Union (ITU, a United Nations agency).
Technology
In order to measure a nation’s external presence in research and development, the IEPG monitored international patents, which reveal a country’s the capacity for scientific and technical innovation. Its employs data on so-called foreign-oriented patents, which are interrelated patent applications filed in one or more foreign countries to protect the same invention. The country of origin is the residence of the first-named applicant (or assignee). For the purposes of measuring global presence, the Index only uses patents for scientific-technical production with a clearly transnational component. The source is the statistics database of the World Intellectual Property Organisation.
Science
The previous indicator is complemented by another that reflects university activity in the field of research, because the generation of patents is generally linked to hard science research. The indicator does not include research in the social sciences, arts and humanities.
A country’s global presence in terms of science and research is measured by the number of scholarly articles published in well-established scientific journals. One way of grouping these journals is by using the Thomson Reuters indexes. In this case each country is assigned its scientific production in the Web of Science.
In order to attribute scientific production to individual countries, Thomson Reuters uses as a reference the domicile of the author of an article published in a scientific review. The assumption is that the domicile is located in the same country as the university with which the author is institutionally affiliated. Thus, it is possible to attribute scientific production to different universities, and therefore to different countries.[8] The source for the indicator is Thomson Reuters, which has provided the data expressly for the IEPG.[9]
Education
This indicator shows the total number of foreign students present in each of the chosen countries, counting students in all tertiary education programmes (both undergraduate and postgraduate), including colleges, universities, technological institutes and polytechnics. The idea is to determine the universities’ international presence in the sphere of teaching. The source used by the Index is the United Nations Educational, Scientific and Cultural Organisation (UNESCO Institute for Statistics).
Development Cooperation
In the area of development cooperation, as it is impossible to include a result indicator, it has been necessary to include an instrumental indicator instead. It was decided to include Official Development Assistance (ODA) as an indicator of global presence in the area of development assistance, even though it has the disadvantage of considering budgetary spending (an instrumental variable) instead of the result of the expenditure in terms of a country’s presence (a result variable).
The Index uses gross total official aid provided by each country, not just net ODA. In this way it includes both donations and reimbursable aid, and bilateral as well as multilateral aid. The source for the data is the OECD. Aid data for the so-called DAC donors (donor members of the OECD’s Development Assistance Committee) are accessible through the OECD.Stat database, while data on non-DAC donors is provided by the OECD (2010) in its annual publications. Data not covered in this source have been taken from Aid Data.
Donors that are not members of the DAC have no obligation to report their aid statistics. Hence, using only the two international databases mentioned above, the number of cases to be estimated for this indicator would have been more than 50 (from 1990 to 2011). In order to avoid such a large number, in this specific case, national databases were used and experts in south-south cooperation consulted. This affects the data for Argentina (2005 and 2010), Brazil (1995 and 2000), Malaysia (2005 and 2010), Venezuela (2005 and 2010),[10] Brazil (2005),[11] Chile (1995, 2000, 2005, 2010 and 2011),[12] China (2000, 2005, 2010 and 2011),[13] Colombia (2000 and 2005),[14] India (2000[15] and 2005[16]), Malta (2005),[17] Mexico (2010),[18] Rumania (2005),[19] Russia (2005, 2010 and 2011),[20] South Africa (2000[21] and 2005[22]) and Thailand (1995).[23] In some cases, it has been preferable to assign Development cooperation a nil presence in the total IEPG, for specific countries and years, rather than resorting to estimates on the basis of the techniques explained below. This has been the case for Brazil, Chile and Colombia (for the 1990 IEPG), Bulgaria, Slovakia, Slovenia, Estonia, Hungary, Latvia, Lithuania, Malta, Rumania and South Africa (1990 and 1995).
Graph 1. IEPG: Structure
Estimates for Missing Data
Up to 95% of the 5,200 data necessary to calculate all the parameters, countries and years are available. Around 5% have had to be estimated, especially for countries with a lower global presence and for the earliest data (1990 and 1995).
Estimates for missing data have been made by hot-deck imputation, using the following criteria: (i) in no cases are the estimates made to the original value but rather to the 0-1,000 value of the IEPG model; (ii) the priority is to have a balanced model for each country and year; (iii) estimates are made according to existing variables, not external ones; and (iv) more recent information is preferred to older data.
In any case, the number of missing data is low and concentrated in the earliest years, in countries with a lower global presence and in variables with a lower weighting (Appendix 2). Thus, imputed cases account for less than 0.5% of the final model as a whole.
Linearity of the Variables
Certain variables measuring power, influence or presence can show non-linear behaviour in the sense that an increase of x% in the value of the variable does not produce an equivalent increase of x% (or a.x%) in the amount of presence, power or influence of a country. An example is the possession of nuclear weapons: the increase in power involved in rising from zero to one is substantially greater than that of rising from 200 to 300. On the contrary, if the variable is presumed to have a linear behaviour, it is being assumed that the increase in presence is proportional to that of the variable’s value.
Given that the IEPG measures presence and not influence or power, a linear behaviour has been considered for each indicator. Therefore, in general terms, an increase results in a proportional increase in global presence.
There is, however, an exception with the Sports variable. It is the only input parameter that maintains the 0-1,000 scale constant, since ‘current medals’ = ‘constant medals’. This means that the variable’s weighting in the model increases as time progresses. To correct this bias a deflator has been introduced, derived from the IEPG’s average value once medals have been excluded. Thus, in 1990 the variable’s weight is half what it is in 2010. The weighting for each year is shown in Table 2.
Table 2. Weight of the Sports Variable
| 1990 | 1995 | 2000 | 2005 | 2010 | 2011 |
| 0.48 | 0.56 | 0.58 | 0.82 | 1.00 | 1.05 |
Limits of Scale
Fixed limits of scale have been defined in the entire series and for all the years. One of the Index’s most interesting features is the possibility of analysing its values over time.
With this in mind, it was decided that the IEPG’s scales would run from 0 to 1,000, with the following fixed minimum and maximum limits:
- Minimum limits: 0 points are assigned to the 0 value of each indicator. For instance, 0 points in the Economic presence area would mean that the sum of its indicators would be equal de 0 Dollars for the country in question.
- Maximum limits: 1,000 points are assigned to the maximum value of the indicator in the year 2010 for the countries analysed. In other words, if in 2010 the maximum value for the Technology indicator corresponds to Japan, with 59,003 patents, this number of patents is assigned 1,000 points on the scale. And so on, for the rest of the indicators featured in the Index.
This definition of minimum and maximum limits for the IEPG’s scales means that the Index will have 2010 as its base year. This in turn means that, in practical terms, the value of the Index in subsequent years will always be referenced to the 2010 values of the indicators. This will allow for a comparison over time to verify the intrinsic evolution of each country, in addition to a transverse comparison between countries.
Meanwhile, this also means that in subsequent years, the value of the IEPG for certain countries might exceed 1,000 points. This definition is similar to that of stock market indexes, which start with a certain year as a base figure and rise or fall depending on how the market performs. Such is the case of the IBEX 35, Spain’s main stock market index, whose 3,000-point 3,000 point base dates back to 29 December 1989.
How to Assign Weightings?
Although it is evident that the three areas of presence –economic, military and soft– do not contribute to the same degree to a country’s global presence, it is difficult to assign a specific weighting to each of the areas and to each indicator within them. It was for this reason that, in order to define a second level of weightings, it was decided to resort to a panel of experts in international relations. The panel was based on the report on think-tanks prepared annually by the University of Pennsylvania,[24] covering a total of 150 institutions involved in the study of international relations. The number of institutions included in the study for each region is in accordance with the original source’s global distribution: 30% in North America, 27% in Europe, 18% in Asia, 11% in Latin America and the Caribbean, 8% in Africa, 5% in the Middle East and North Africa and, finally, 1% in Australasia. Nevertheless, with the aim of building a list of at least 100 think tanks it was decided to take into account a larger sample in order to compensate for the fact that contact with some of them might be impossible to establish. Hence, the questionnaire was finally sent to 45 institutions in North America, 40 in Europe, 27 in Asia, 17 in Latin America, 12 in African, eight in the Middle East and North Africa and three in Australasia.
All of them received a questionnaire with the object of assigning a specific weighting to each indicator, submitted to each institution’s head of research, to its highest-ranking research specialist or, ultimately, simply to the institution itself. In addition to deciding on an electronic survey that would allow changes in the order of the indicators and areas –to avoid ipsative problems–, two types of questionnaire were designed. The first asks the respondent to assign weightings to the IEPG’s elements in its two levels, both by area and by indicator (Appendix 3). To prevent the number of indicators per area from influencing the respondents’ answers, half the sample received a questionnaire in which indicators were to be assigned weightings on only one level, regardless of the area they pertained to (Appendix 4). The weightings obtained from the answers received are shown in Table 3.
Table 3. Weightings by Area and Indicator
| Area | Indicator | Weighting Coefficient (%) |
| Economy | 38.50 | |
| Energy | 6.95 | |
| Primary Goods | 5.13 | |
| Manufactured Goods | 7.44 | |
| Services | 8.88 | |
| Investment | 10.10 | |
| Military | 15.52 | |
| Troops | 7.95 | |
| Equipment | 7.57 | |
| Soft Presence | 45.98 | |
| Migrations | 4.11 | |
| Tourism | 4.10 | |
| Sports | 3.42 | |
| Culture | 6.98 | |
| Information | 5.99 | |
| Technology | 5.82 | |
| Science | 5.71 | |
| Education | 5.45 | |
| Cooperation | 4.40 |
Coordinators: Iliana Olivié, Senior Analyst for International Cooperation & Development, and Ignacio Molina, Senior Analyst for Europe. Coordinators of the IEPG.
Contributors: Ignacio Álvarez, Bruno Ayllón, Rafael Domínguez, Félix Arteaga, Manuel Gracia, Narciso Michavila, Antonio Vargas. [25]
See: Appendix
[1] Iliana Olivié & Ignacio Molina (2011), ‘Elcano Global Presence Index (IEPG)’, Estudios Elcano nr 2, Real Instituto Elcano, Madrid.
[2] The exception is development cooperation, where means are used given the impossibility of using a results-based variable.
[3] This principle also governs the criteriafor selecting countries.
[4] The ranking of the main economies is based on the GDP in current dollars and without adjusting for Purchasing Power Parity (PPP). It was decided that the selection of countries –in keeping with the idea of measuring presence in absolute rather than relative terms– would take into consideration the size of the economy in relation to the total world economy, without adjusting for internal living conditions in each country: for the purposes of the IEPG, the important factor is not a country’s income level but its weight in world production.
[5] Olivié & Molina (2011). This document reflects the debates on the selection of indicators that occurred during the preparation of the Index.
[6] http://unctadstat.unctad.org/UnctadStatMetadata/Classifications
/UnctadStat.SitcRev3Products.DegreeOfManufacturing.Classification_En.pdf.
[7] The authors are grateful to Francisco Asensi, Alberto de Blas, Amador Enseñat, Ignacio Horcada, Dagmar de Mora-Figueroa, Pablo Murga, Diego Ruiz Palmer, Andrés Sanz, Steven R. Sturn and Federico Yáñez for their comments and suggestions while re-designing this area of the IEPG.
[8] In the event of co-authorship, when the authors live in more than one country, one scientific article is attributed to each of the countries associated with the authors.
[9] The Index’s coordinators re especially grateful to Philip Purnell of Thomson Reuters for collecting and transmitting the data.
[10] DESA (2010), ‘Development Cooperation for the MDGs: Maximizing Results’, International Development Cooperation Report ST/ESA/236, Department of Economic and Social Affairs, United Nations.
[11] Kimberley Smith, Talita Yamashiro Fordelone & Felix Zimmermann (2010), ‘Beyond the DAC. The Welcome Role of Other Providers of Development Co-Operation’, DCD Issues Brief, OECD/DAC, May.
[12] Omar Herrera (2010), ‘Diagnóstico institucional y propuesta de mejoramiento de la AGCI’, Estudios de Caso 106, Ingeniería Industrial, Universidad de Chile.
[13] Chinese Finance Ministry.
[14] Official data from Acción Social de Colombia, converted to US Dollars applying the exchange rates of the Central Bank of the Republic of Colombia.
[15] Indian Ministry of Foreign Affairs.
[16] Dweep Chanana (2010), ‘India’s Transition to Global Donor: Limitations and Prospects’, ARI nr 123/2010, Real Instituto Elcano, July.
[17] CE (2011), ‘EU Accountability Report 2011 on Financing for Development. Review of Progress of EU and its Member States’, SEC(2011)500final, European Commission, Brussels,April.
[18] SEGIB (2010), ‘Informe de la cooperación Sur-Sur en Iberoamérica 2010’”, Estudios SEGIB 5, Secretaría General Iberoamericana, November.
[19] CE (2011).
[20] Russian Finance Ministry.
[21] Revue Internationales de Politique de Développement (2012), Dossier. L’Aide bousculée. Pays émergents et politiques globales, March.
[22] South African National Treasury.
[23] Data from the Thai Cooperation Agency, TICA (Thailand International Developmment Cooperation Agency) converted to US Dollars applying the exchange rates of the US Federal Reserve.
[24] James G. McGann (2012), ‘The Global Go To Think Tanks Report 2011. The Leading Public Policy Research Organizations in the World’, Final United Nations University Edition, January.
[25] Ignacio Álvarez, Lecturer of the Universidad de Valladolid; Bruno Ayllón, Associate Researcher to the Instituto Universitario de Desarrollo y Cooperación (IUDC) of the Madrid Complutense University; Rafael Domínguez, Lecturer of the Universidad de Cantabria; Félix Arteaga, Senior Analyst, Elcano Royal Institute; Manuel Gracia, Contributor of the IEPG project; Narciso Michavila and Antonio Vargas, members of GAD3 consultancy and responsible for developing the web www.iepg.es.