


Theme
How does the Elcano Global Presence Index rate the US global presence, including its geographical distribution, in comparison with the goals of the 2022 National Security Strategy?
Summary
This work compares the stated goals of US foreign policy –according to its 2022 National Security Strategy– with the results of the Elcano Global Presence Index, including a geographical disaggregation by destination.
The US has led the globalisation process in recent decades despite the rise of China. In addition to an increased presence across all dimensions –economic, military and soft– since 1990, the US also still ranks first in almost every variable of the Index. However, the country has also recorded a marked loss of global presence share in the context of rising emerging countries –particularly from Asia– in the globalisation process.
The results of the geographical breakdown show a high concentration of the US’s external projection in the UK and Japan, as well as in its own region. Despite the strong shift towards the Pacific, and particularly towards China, the UK and Germany are among the US’s main partners.
Regional projection decreases in relative terms with respect to its 2005 levels, while that in the EU increases, although in non-traditional partners. There is also a strengthening of military presence in the UK following Brexit. In general terms, the decrease of external projection in some regions goes in parallel with an increasing presence in Asia-Pacific, reflecting the shift towards the Pacific in the globalisation process over the last decades. There is also a significant share of presence in the rest of the G7 partners, identified in the National Security Strategy as a priority forum for interregional cooperation. In the rest of the regions (Latin America, Africa and the Middle East) the US presence is particularly low.
Analysis
The Elcano Global Presence Index was first published in 2011, with the aim of providing a tool for the analysis of international relations. The Index gathers detailed information on the external projection of the 150 countries for which it is calculated: the scale of their global presence in the economic domain (exports, foreign investments) as well as in the military (troops deployed, equipment) and soft realms (migrations, tourism, sports, culture, information, technology, science, education, development cooperation, and climate change).
The results of the Index, though, raise the relevant question on how such a presence is distributed geographically. For instance, data show that the US global presence is at 3,655 index value points in 2022, built on economic presence at 49%, military variables at 29% and soft indicators at 22%. However, the Index does not provide information on the amount or share of presence that is projected regionally, towards Asian countries or in European allies; nor how such proportions might vary over time.
This latter question has been gaining salience recently, given the geopolitical shift towards a fragmented international system, with explicit rivalries between global or regional powers such as the US and China, China and India or the EU and Russia, and with the perception of a decreasing presence of Western players in Africa and Latin America. In addition, this could lead to increased levels of regionalisation, since according to previous analyses based on the Elcano Global Presence Index, globalisation is a concentrated phenomenon, with a small number of countries and players accounting for a large part of world exchanges of all sorts.
Against this backdrop, in October 2022 the White House issued a National Security Strategy that emphasises the need for the US to reinforce its international alliances in –what the Biden Administration identifies as– a framework of competition between democracies and autocracies.
In a similar vein to previous studies on the EU, Spain or Portugal, this paper aims to explore the external projection of the US by breaking down its global presence index by geographical (country and regional) destination. The first section goes through the volume, scale, share and nature of the US’s external projection. The following sections delve into its presence in its main allies or competitors, in accordance with the strategic document: China, Russia, the Indo-Pacific, Europe, the Western Hemisphere, the Middle East and Africa. By doing so, the Elcano Global Presence Index allows a comparative analysis between the stated and de facto international links of the US.
The US in the world
The US records 3,655 index value points in the Elcano Global Presence Index. With a projection more than twice that of China, which ranks second, it leads the Index and has been doing so in all years for which it is calculated, since 1990 (Figure 1). This leadership is manifest in all three economic, military and soft dimensions (Figure 2). In 2022 the US also ranked first in almost every variable in the Index, with the exceptions of Energy and Manufactures in the economic dimension and Science, Information, Tourism and Climate change in the soft domain.
Figure 1. Elcano Global Presence Index top 10 positions (position and index value in 2022)
Figure 2. The US in the Elcano Global Presence Index: index value and position by dimension (2022 values)
As a result, the US accounts for more than one fifth of the aggregate global presence of the 150 countries for which we calculate the Index. It records the highest shares of global (22%), economic (20%), military (29%) and soft (20%) presence.[1] This particularly high share in the military domain echoes a significant contribution of the military dimension, which is currently at 29%[2] –a feature usually found in developing countries with less economic or soft presence–. Five variables account for 78.5% of the US’s global presence: investments (35.8%), military equipment (14.5%), troops deployed (14.3%), technology (7.6%) and services (6.3%) (Figure 3).
Figure 3. Contributions by variables to the US’s Elcano Global Presence Index (2022 values)
Despite this very clear leadership in the international scenario, the US has been losing ground in relation to other global players, particularly China, and especially during the years of faster globalisation, in the early 2000s. As a result, its share of global presence is lower today than it was in 2000, when it peaked at 26.1%. It should be noted, however, that unlike the EU and, therefore, a good number of European countries, the US quota has been steadily recovering after the Great Recession, when it recorded a low of 19.7% in 2012 (Figure 4).
Figure 4. Global presence and US quota (index value points and %, 1990-2022)
As mentioned above, through additional data sources we were able to calculate the geographical distribution of the US’s global presence. These data refer to 2005 and 2022 –so that we can track an eventual process of decoupling– and allow the calculation of the share of the US’s external projection in 33 countries, six regions and 11 groupings. We have selected countries, regions and groupings highlighted in the National Strategy as both allies or competitors. By regions and groupings, the US’s external projection is clearly oriented towards Europe and Asia, with over 34% of its global presence projected in the EU, plus 11.8% in other European countries, and nearly 23% in the Indo-Pacific, vs 10.5% in Latin America and the Caribbean and only 4.9% in the Middle East and 2.6% in Africa (Figure 5). It should also be noted that the shares of projection in Europe, the Indo-Pacific and Africa have increased since 2005 (2, 4 and 0.6 percentage points, respectively), while those in Latin America and the Middle East have notably decreased (Figure 5).
Figure 5. Geographical distribution of the US’s global presence by region and grouping (share in 2022 and variation 2005-22 –% points in brackets–)
The UK is the US’s main partner, followed by Japan, Canada, China and Germany (Figure 6).
Figure 6. Geographical distribution of the US’s global presence by country (share in 2022 and variation 2005-22 –% points in brackets–)
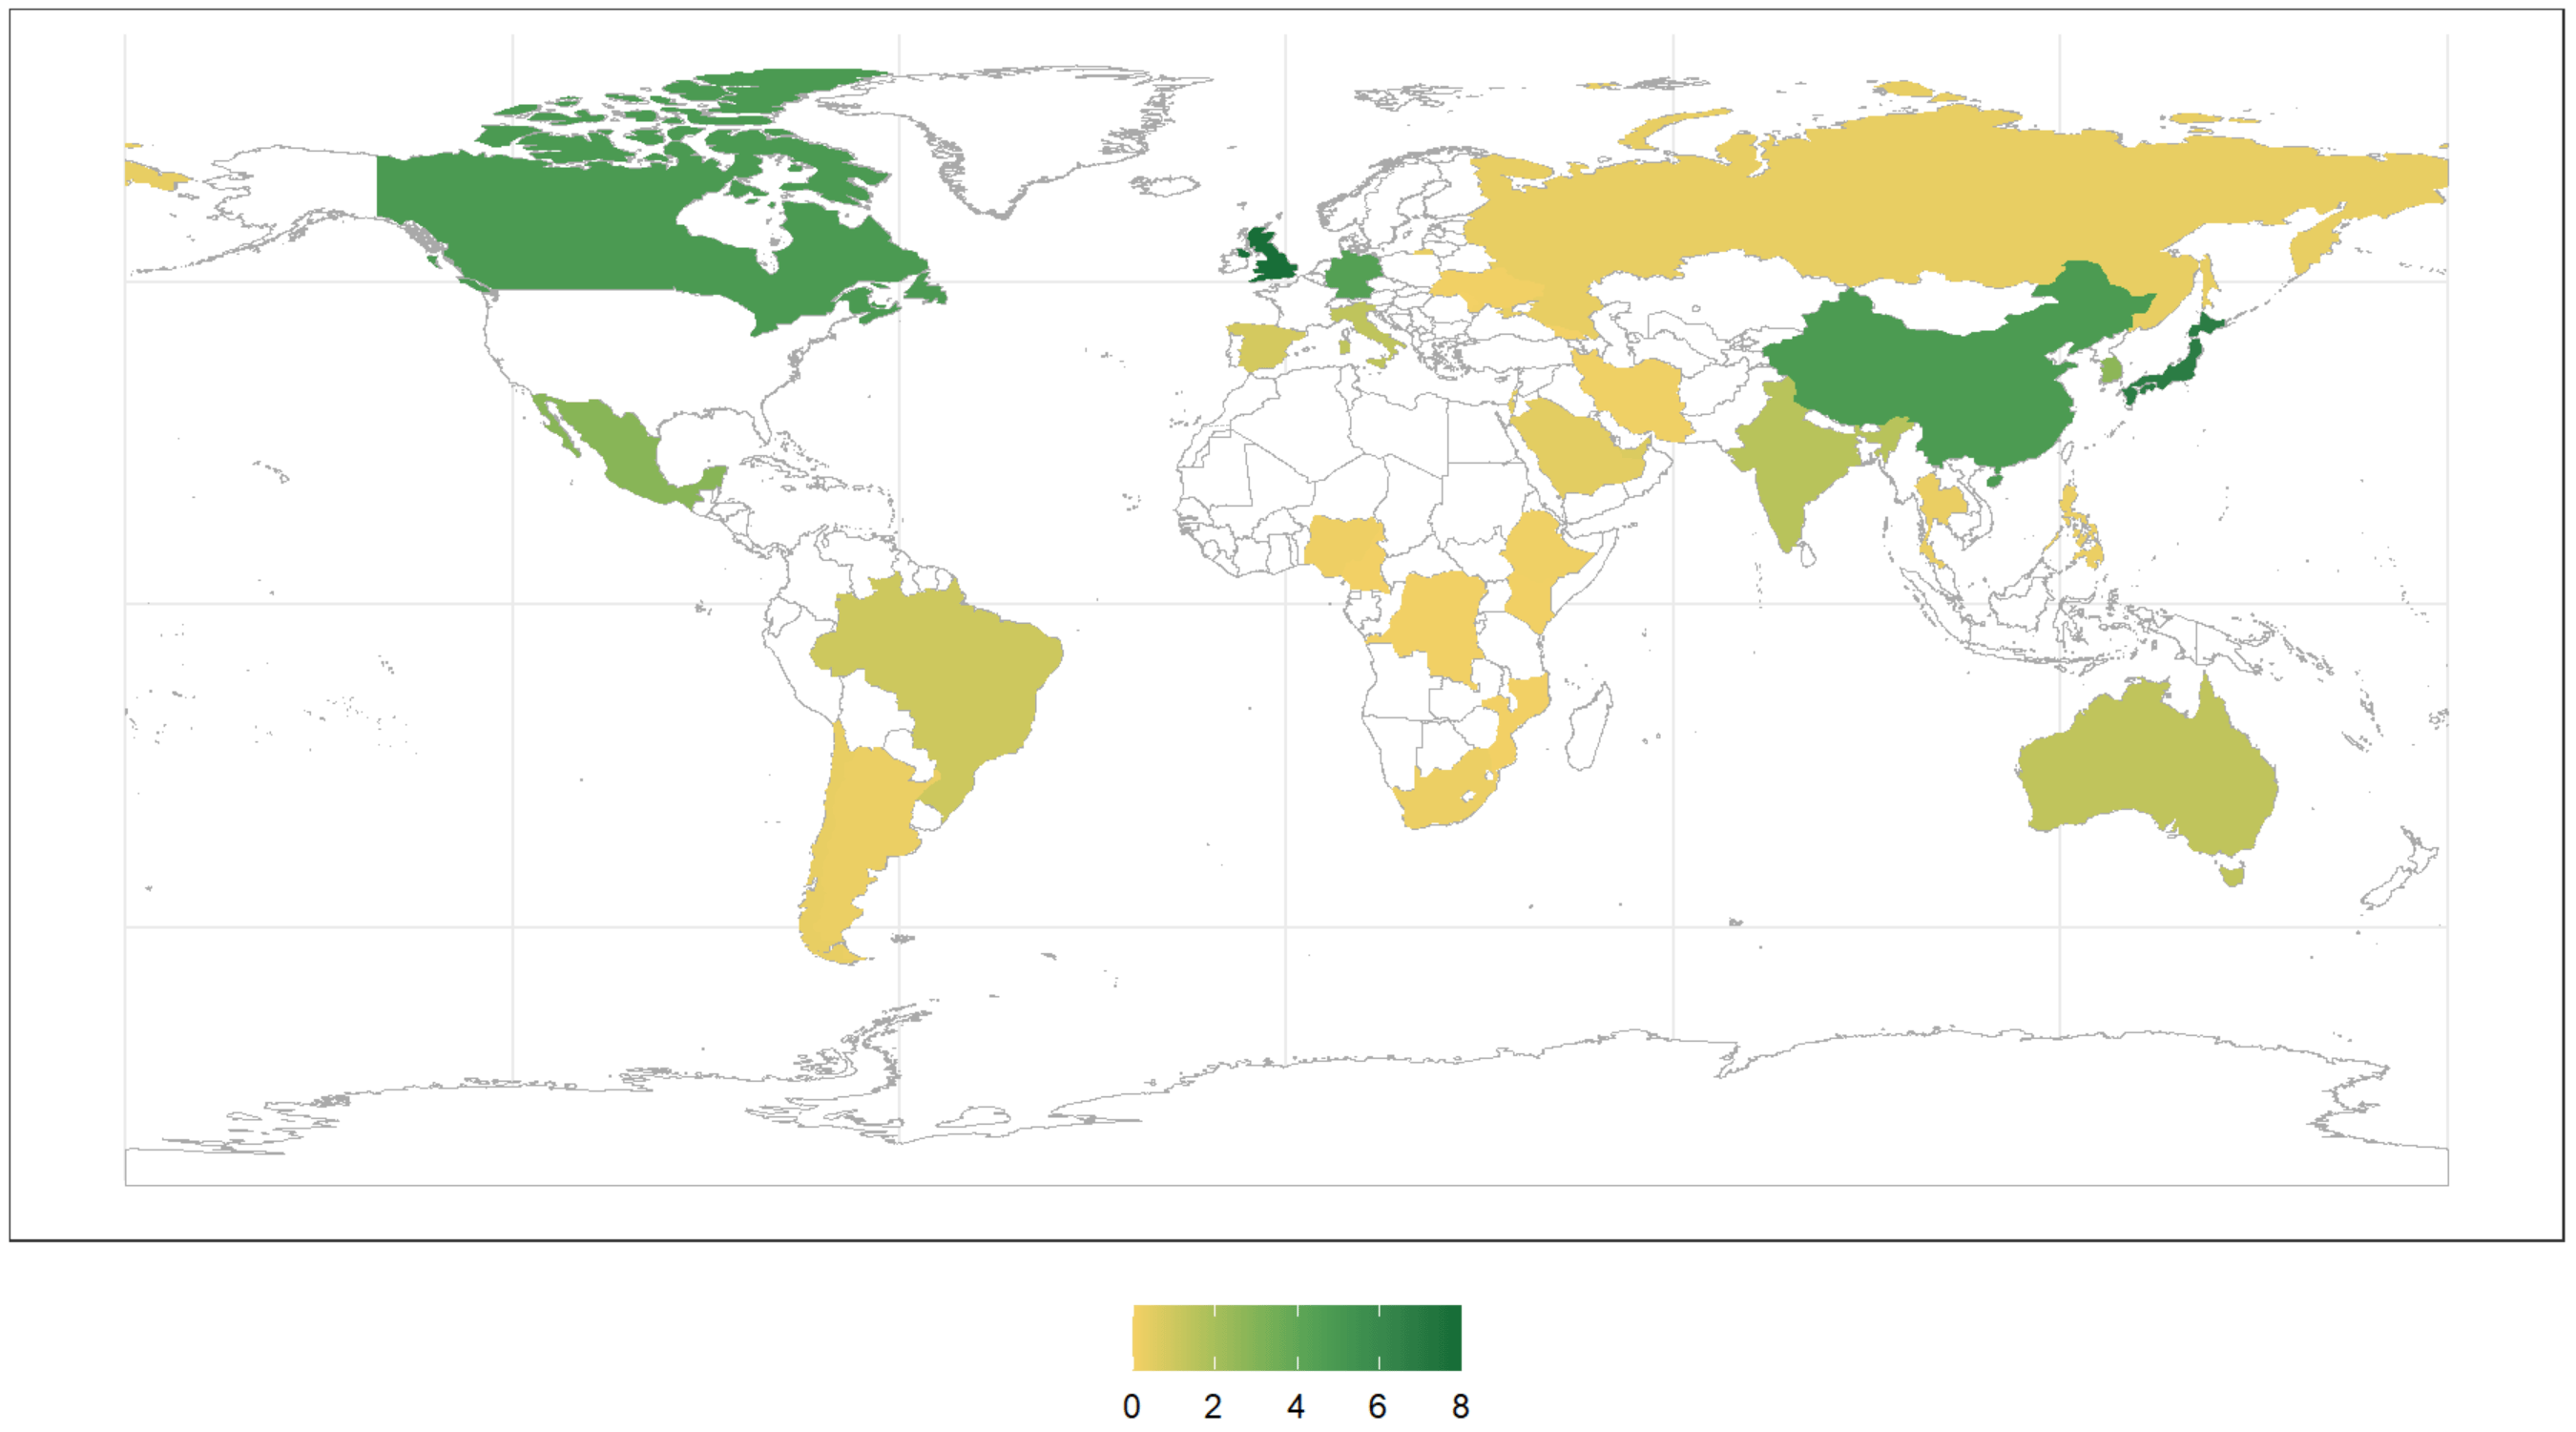
Map 1. Geographical distribution of the US’s global presence, 2022 (% of total presence)
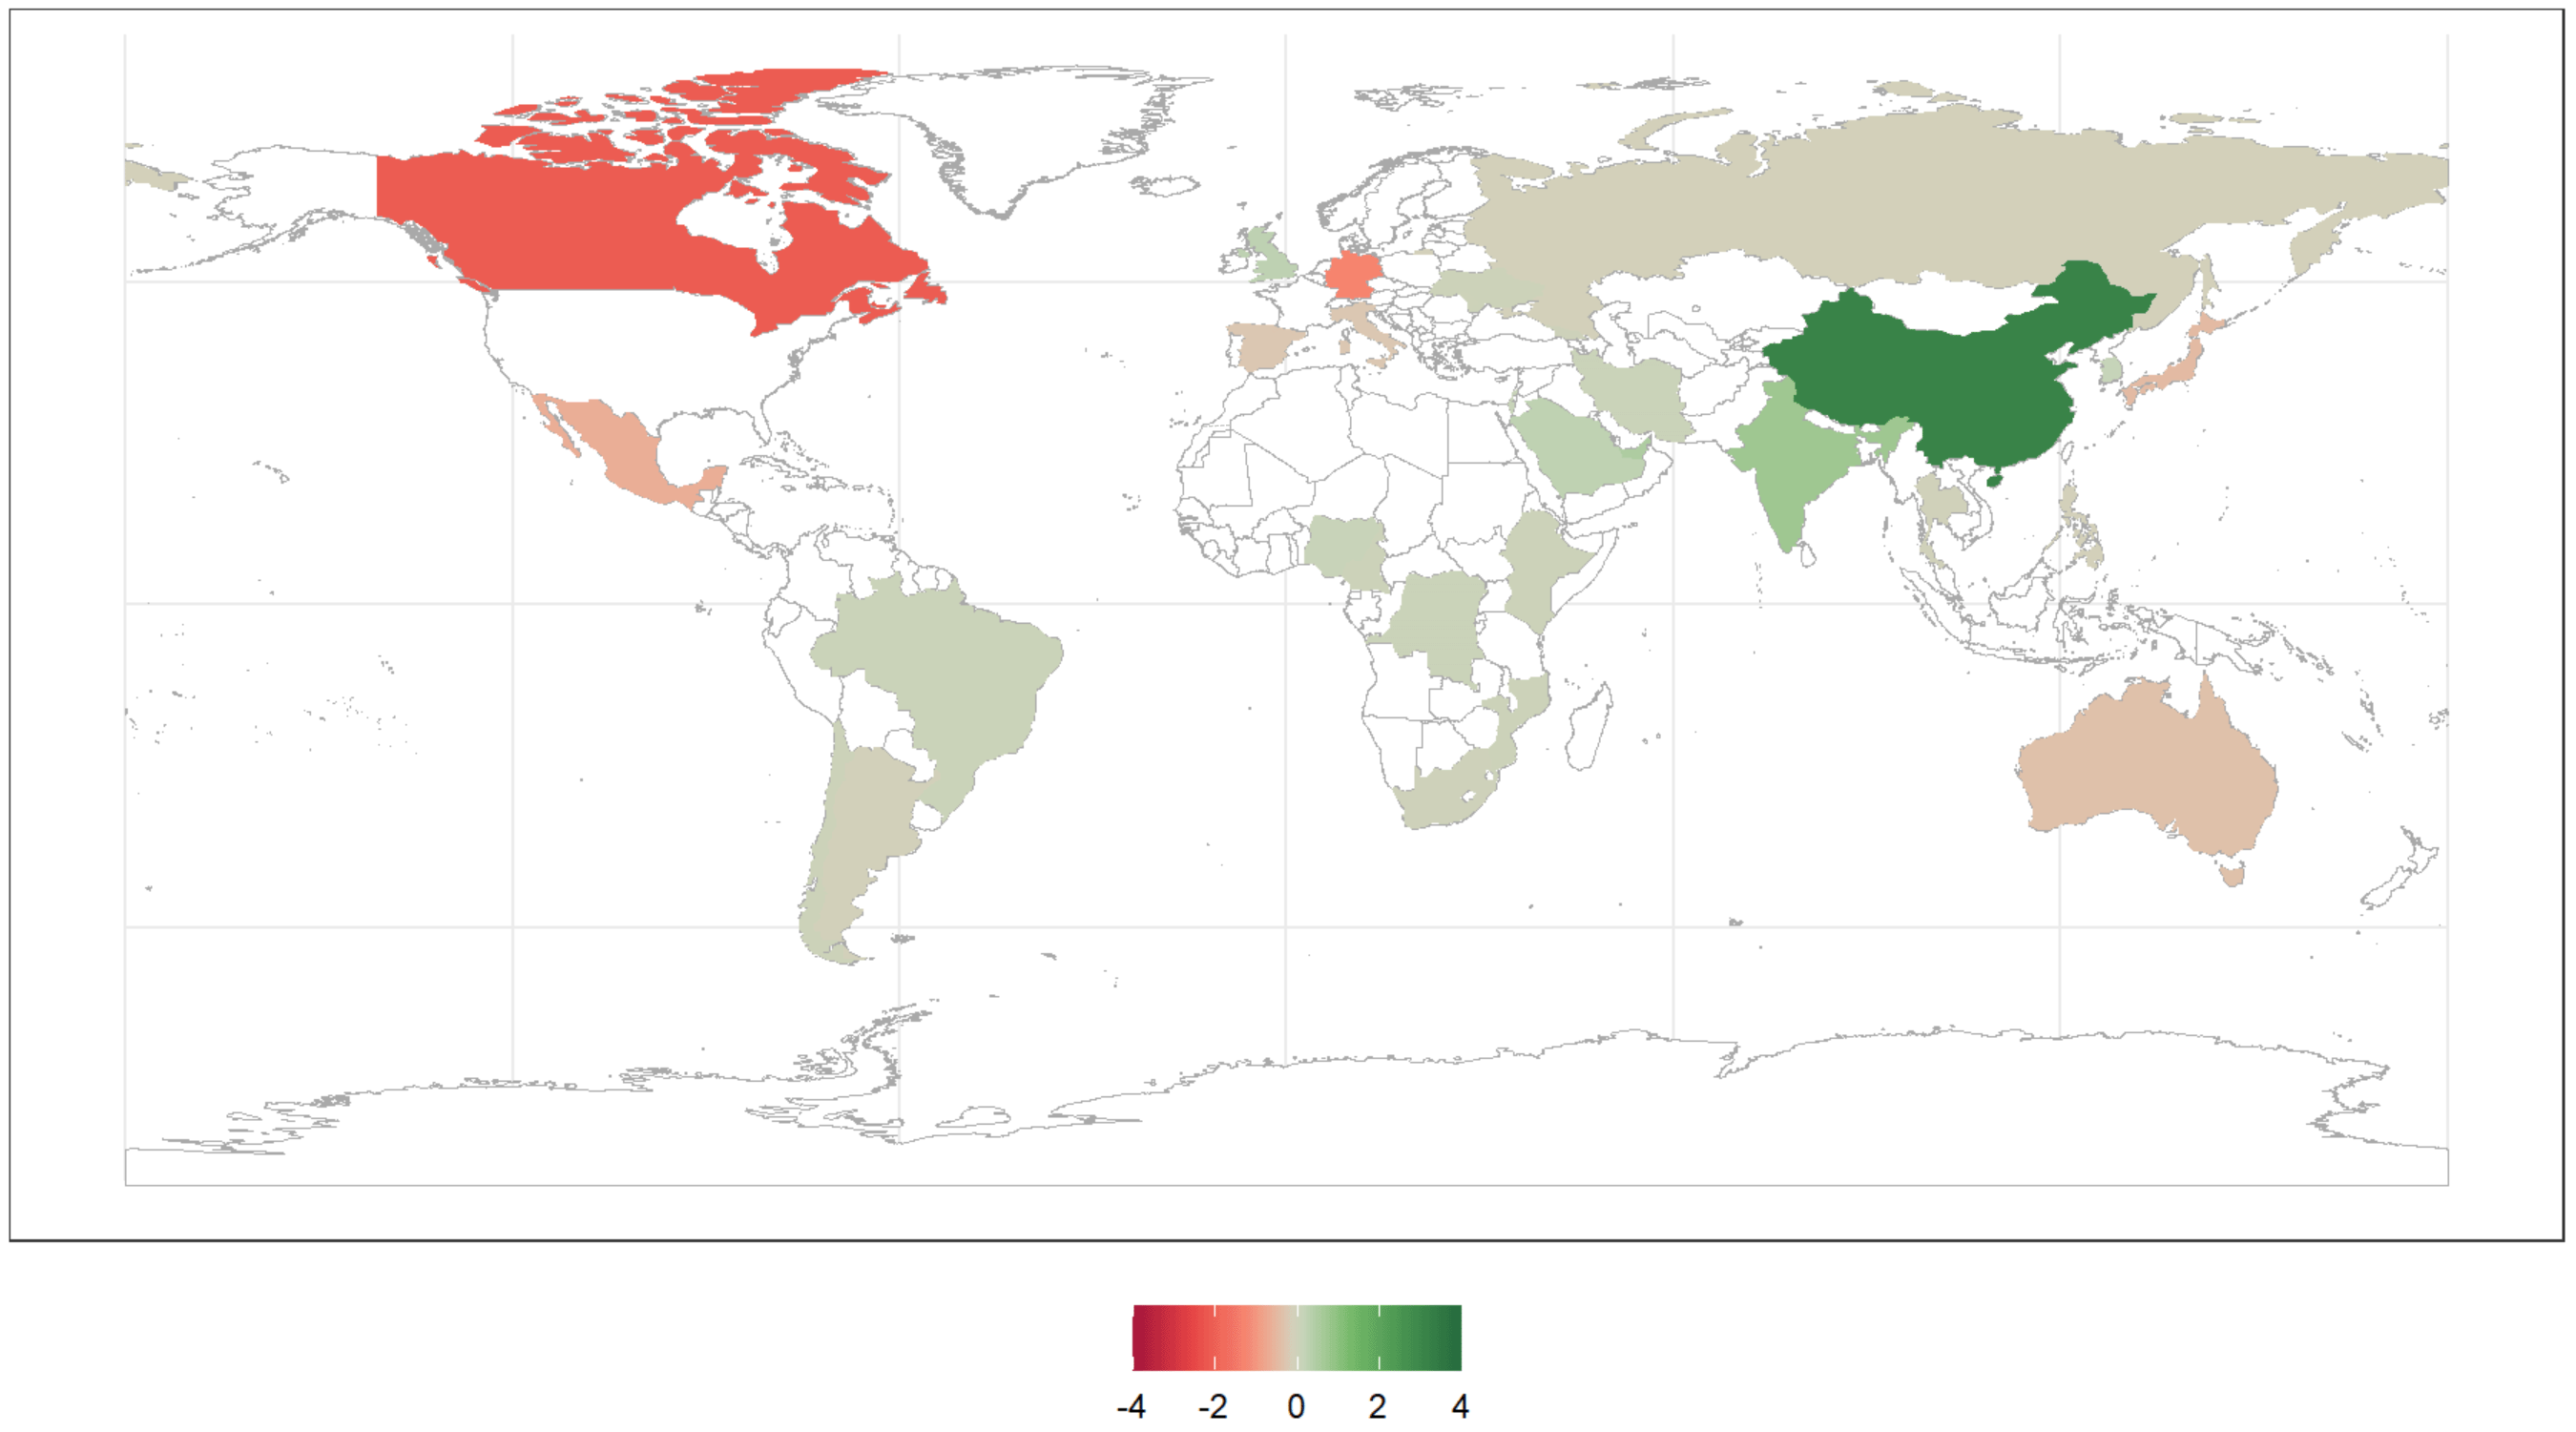
Map 2. Change in the geographical distribution of the US’s global presence, 2005-22 (% points)
Out-competing China and constraining Russia
Two of the US’s declared priorities in terms of national security are out-competing China and constraining Russia. While these two countries are seen as competitors, rivals or even enemies, they also account for a significant share of the US’s global presence, particularly in the case of China, which is its fourth destination and accounts for 4.8% of the US’s projection.
Moreover, although the US presence in Russia has slightly decreased in the last two decades, that in China has significantly increased, by 3 percentage points (Figure 6). These data contrast with the confrontational narrative of the past two Administrations with respect to the country’s relations with the Asian giant. The nature of the US presence in China has also evolved. It is now much softer and less economic than it was in the mid-2000s (Figure 7) and, to a great extent, such a dynamism has been led by the variables of technology and science that are, precisely, the domains highlighted in the strategic document as an area of competition between the two countries (Figure 9).
Figure 7. US presence in China by dimension, 2005-22 (% over US global presence)
Figure 8. US presence in China, main variables in 2022 and 2005 (% over the US’s global presence)
The US presence in Russia is relatively scarce. It is now at only 0.3% of the US’s external projection, has slightly decreased by 0.1 percentage points since 2005 and is, as in the case of China, soft rather than economic or military (Figure 11).
Figure 9. US presence in Russia, by dimension (% over the US’s global presence and change 2005-22 in % points)
A free and open Indo-Pacific
The Indo-Pacific is identified as the main regional priority in the Biden-Harris strategy. This is so for several reasons, including the shifting epicentre of world activity from the Atlantic to the Pacific –as shown in previous analyses of the Elcano Global Presence Index– and China’s influence in the region. In addition to a series of bilateral approaches with key countries –Australia, Japan and South Korea, for instance– the US takes a regional approach with the stated aim of strengthening its relations with (or within) ASEAN, Quad, Aukus, IPEF and APEC. All these groupings, and most of their country members individually, have gained weight in the world scenario over the past decades. For instance, APEC accounted for 37% of the aggregate global presence of all 150 countries in 1990. The figure is now at 54%. Although with a much more discrete role, ASEAN has followed a similar trend, from 2% of total global presence in 1990 to 4% in 2022.
Although the US has increased its share of presence in the Indo-Pacific region as a whole, it has lost some in several of the organisations and groupings, notably in APEC and IPEF –something that might explain the launching of this latter initiative in 2022 (Figure 12)–. Something similar occurs with some of its key allies in the region: an increased relative presence of the US in South Korea and, especially, India, seems to crowd-out its presence in other traditional partners such as Japan, Australia, Thailand and the Philippines (Figure 13).
Figure 10. US presence in the Indo-Pacific region, by grouping and by dimension (% over the US’s global presence and change 2005-22 in % points)
| % of United States’ global presence, 2022 | Variation 2005-2022, percentage points | |||||||
| Economic | Military | Soft | Global | Economic | Military | Soft | Global | |
| APEC | 14.8% | 6.1% | 7.8% | 28.6% | -2.6 | -1.4 | 2.0 | -2.0 |
| Indo-Pacific | 8.4% | 6.9% | 7.3% | 22.6% | 0.2 | 1.4 | 2.6 | 4.2 |
| IPEF | 6.4% | 6.1% | 3.3% | 15.7% | -0.4 | -1.4 | 0.2 | -1.6 |
| QUAD | 2.9% | 4.6% | 2.1% | 9.6% | -0.9 | 0.8 | 0.0 | -0.1 |
| AUKUS | 7.0% | 0.8% | 1.4% | 9.2% | -0.3 | 0.3 | -0.2 | -0.1 |
| ASEAN | 2.8% | 0.0% | 0.9% | 3.8% | 0.6 | 0.0 | 0.1 | 0.8 |
Figure 11. US presence in the Indo-Pacific region, by country and by dimension (% over the US’s global presence and change 2005-22 in % points)
| % of United States’ global presence, 2022 | Variation 2005-2022, percentage points | |||||||
| Economic | Military | Soft | Global | Economic | Military | Soft | Global | |
| Japan | 1.5% | 4.5% | 0.8% | 6.8% | -0.8 | 0.7 | -0.4 | -0.5 |
| Korea, Rep. | 0.7% | 1.5% | 0.6% | 2.7% | 0.0 | 0.1 | 0.0 | 0.1 |
| India | 0.6% | 0.0% | 0.9% | 1.5% | 0.3 | 0.0 | 0.4 | 0.7 |
| Australia | 0.9% | 0.0% | 0.4% | 1.3% | -0.5 | 0.0 | 0.0 | -0.4 |
| Thailand | 0.2% | 0.0% | 0.1% | 0.3% | -0.1 | 0.0 | 0.0 | -0.1 |
| Philippines | 0.1% | 0.0% | 0.1% | 0.2% | -0.1 | 0.0 | 0.0 | -0.1 |
Europe
Europe, along with the Indo-Pacific, is where the National Security strategy places the greatest emphasis. Priority is given to seeking out ‘new ways to integrate our alliances and develop new and deeper means of cooperation in both regions’. Nevertheless, emphasis is placed on a ‘revitalised G7’ serving as a forum of interregional cooperation.
In 2022 the G7[3] represented slightly more than a quarter of the US’s external projection, with a distinctly economic profile and more military than soft links. Its importance in the National Security Strategy is not surprising, but the lack of references to the G20 perhaps is.
Figure 12. US presence in Europe, G20, G7 and NATO, by grouping and by dimension (% over the US’s global presence and change 2005-22 in % points)
| % of United States’ global presence, 2022 | Variation 2005-2022, percentage points | |||||||
| Economic | Military | Soft | Global | Economic | Military | Soft | Global | |
| G20 | 24.2% | 10.4% | 11.0% | 45.7% | -3.5 | -1.5 | 1.9 | -3.1 |
| G7 | 14.0% | 8.5% | 3.9% | 26.5% | -3.8 | 0.4 | -1.0 | -4.4 |
| OTAN | 23.4% | 4.8% | 4.4% | 32.5% | 0.3 | 0.2 | -0.6 | -0.2 |
| UE | 26.4% | 4.3% | 3.8% | 34.5% | 2.7 | -0.1 | -0.4 | 2.1 |
| Europe, rest | 8.2% | 1.2% | 2.3% | 11.8% | 6.0 | 0.9 | 1.3 | 8.2 |
Despite the importance of the region in its international ties, the G7 is, after the Middle East, where the presence of the US has decreased the most in percentage points since 2005. This is the result of the reduction of presence both in Canada and Japan and in key members of the EU. In fact, the only G7 member where the US increased its global presence is the UK. The latter is, moreover, the country where the US has the highest volume of external projection. These results attest to the historical ties between both economies and the maintenance of that transatlantic bridge to Europe, further strengthened after Brexit.
The transatlantic relationship is seen as a pillar of the US’s foreign policy, where Europe is deemed ‘a foundational partner in addressing the full range of global challenges’. There is a notable increase in the presence in this region during the period analysed –over 2 percentage points–, mainly in the economic dimension.
The US has increased its three forms of presence in non-EU European countries as a result of the UK’s exit from the EU: 8 out of the 12 percentage points of share in this region correspond to the country, where it also records an increase of the military dimension. With the rest of non-EU European countries, all dimensions have grown. All in all, the US’s global presence in Europe (46.3% in 2022) is higher than in the G20 (45.5%).
Figure 13. US presence in Europe, by country and by dimension (% over the US’s global presence and change 2005-22 in % points)
| % of United States’ global presence, 2022 | Variation 2005-2022, percentage points | |||||||
| Economic | Military | Soft | Global | Economic | Military | Soft | Global | |
| United Kingdom | 6.2% | 0.7% | 1.0% | 7.8% | -0.2 | 0.7 | -0.2 | 0.2 |
| Germany | 1.4% | 2.4% | 0.6% | 4.5% | -0.6 | -0.6 | -0.1 | -1.3 |
| Italy | 0.3% | 0.8% | 0.2% | 1.3% | -0.3 | 0.1 | -0.1 | -0.3 |
| France | 0.8% | 0.0% | 0.3% | 1.2% | -0.4 | 0.0 | -0.1 | -0.5 |
| Spain | 0.3% | 0.3% | 0.2% | 0.8% | -0.5 | 0.3 | -0.1 | -0.3 |
| Ukraine | 0.0% | 0.0% | 0.1% | 0.1% | 0.0 | 0.0 | 0.0 | 0.0 |
| Georgia | 0.0% | 0.0% | 0.0% | 0.0% | 0.0 | 0.0 | 0.0 | 0.0 |
| Moldova, Rep | 0.0% | 0.0% | 0.0% | 0.0% | 0.0 | 0.0 | 0.0 | 0.0 |
But the focus of the National Security Strategy is, as expected, on the Russian war on Ukraine, which is identified as ‘an immediate and ongoing threat to the regional security order’. Hence, the perspective on the relationship with the EU is intertwined with that of NATO, given the latter’s predominantly European nature. Although it notes that the approach will vary depending on the course of the war, it emphasises encouraging Ukraine’s integration in the EU and defending ‘every inch of NATO territory’. However, it also highlights the need to increase European defence investments as a central element of its security strategy. Perhaps this is the reason why the US military presence in this grouping might be lower than expected, with an increase of 0.2 percentage points after the Crimea invasion, and with more relevance of troops than of deployed military equipment. The US military presence is higher in other groupings, such as the G20 and Indo-Pacific, primarily due to the importance of its military projection in Japan.
The Western Hemisphere
The national security strategy allocates a section to the Western Hemisphere, as the region of ‘greatest impact on its foreign policy’. Two distinct regions stand out: the North American regional integration process and Latin America and the Caribbean.
As for the former, the document emphasises the importance of regional integration processes to enhance competitiveness against the rest of the world. It highlights the priority of strengthening a North American vision with Canada and Mexico. Notably, in 2022, these two countries accounted for 7.7% of the US’s projection, primarily in economic terms and guided by investment and manufacturing export indicators, a consequence of productive mobility processes within the region. In parallel, since 2005 the region has lost relative importance due to the rise of Trans-Pacific connections. Nevertheless, this volume of presence is comparable to that projected towards the BRICS, despite the differences in the number of countries and their population volume.
Figure 14. The US presence in North America, Latin America and the Caribbean, by grouping and by dimension (% over the US’s global presence and change 2005-22 in % points)
| % of United States’ global presence, 2022 | Variation 2005-2022, percentage points | |||||||
| Economic | Military | Soft | Global | Economic | Military | Soft | Global | |
| Central America | 6.4% | 0.1% | 1.4% | 7.9% | -2.1 | 0.0 | -0.2 | -2.3 |
| USMCA | 5.8% | 0.0% | 1.9% | 7.7% | -2.4 | 0.0 | -0.4 | -2.8 |
| Latin America | 1.5% | 0.1% | 1.0% | 2.6% | -0.3 | 0.0 | 0.1 | -0.2 |
Regarding Latin America and the Caribbean, the strategy takes a more restricted perspective. On the one hand, it refers to the Americas Partnership countries –including Barbados, Canada, Chile, Colombia, Costa Rica, the Dominican Republic, Ecuador, Mexico, Panama, Peru and Uruguay–. However, excluding Canada and Mexico, the volume of presence in the rest is still very limited. The entirety of Latin America and the Caribbean barely accounts for 2.6% of the US’s global presence in 2022, of which one point would correspond to Brazil, and only 0.3% to Chile. The nature of the presence is predominantly economic, somewhat soft, but not military, due to the low level of conflicts in the region and the limited US engagement –with most of the deployed forces located in Guantanamo–.
Figure 15. US presence in North America, Latin America and the Caribbean, by country and by dimension (% over the US’s global presence and change 2005-22 in % points)
| % of United States’ global presence, 2022 | Variation 2005-2022, percentage points | |||||||
| Economic | Military | Soft | Global | Economic | Military | Soft | Global | |
| Canada | 3.8% | 0.0% | 1.0% | 4.9% | -1.9 | 0.0 | -0.2 | -2.1 |
| Mexico | 2.0% | 0.0% | 0.8% | 2.8% | -0.5 | 0.0 | -0.2 | -0.7 |
| Brazil | 0.6% | 0.0% | 0.4% | 1.0% | 0.0 | 0.0 | 0.1 | 0.1 |
| Chile | 0.2% | 0.0% | 0.1% | 0.3% | 0.0 | 0.0 | 0.0 | 0.0 |
| Argentina | 0.1% | 0.0% | 0.1% | 0.2% | -0.1 | 0.0 | 0.0 | -0.1 |
The document also addresses the migratory issue and, particularly, irregular migration. Within the US’s global presence composition, the variable of migration has a similar weight to that of technology, at 0.3% of its global presence. Perhaps surprisingly, the primary source of migration is from the Asia-Pacific region.
The Middle East
The Middle East has been a central region in the US’ foreign policy, primarily focused on military links, as the document highlights. The strategy refers to security issues, such as the fight against terrorism or the protection of maritime transport, as well as its involvement in the geopolitical dynamics of the region, such as the Abraham Accords or aspirations for a Palestinian state. This may underscore the need to establish different connections, combining diplomacy and economic assistance.
Figure 16. US presence in the Middle East, by dimension (% over the US’s global presence and change 2005-22 in % points)
The region accounts for 4.9% of the US’ global presence, of which more than 3 percentage points correspond to the military dimension. Without these military ties, the Middle East would be less relevant in the global presence of the US than Sub-Saharan Africa. Compared with 2005, there is a noticeable decline in the relative weight of its military presence in the region, mainly explained by the withdrawal from Afghanistan and Iraq in 2021. But the loss is not being replaced by economic or soft presence.
Figure 17. US presence in Middle East, by country and by dimension (% over the US’s global presence and change 2005-22 in % points)
| % of United States’ global presence, 2022 | Variation 2005-2022, percentage points | |||||||
| Economic | Military | Soft | Global | Economic | Military | Soft | Global | |
| United Arab Emirates | 0.2% | 0.4% | 0.1% | 0.6% | 0.0 | 0.4 | 0.0 | 0.5 |
| Israel | 0.3% | 0.0% | 0.1% | 0.4% | 0.1 | 0.0 | 0.0 | 0.1 |
| Saudi Arabia | 0.2% | 0.1% | 0.1% | 0.4% | 0.0 | 0.1 | 0.1 | 0.2 |
| Iran | 0.0% | 0.0% | 0.1% | 0.1% | 0.0 | 0.0 | 0.0 | 0.0 |
By countries, the highest presence in the region is recorded in the UAE, followed by Israel and Saudi Arabia. The US maintains primarily economic and partially soft-power ties with these countries, with hardly any changes throughout the period. Military presence is less prominent at the country level due to the inherently regional nature of many missions, such as those in the Arabian Sea, the Gulf of Oman or the Persian Gulf. The US military presence in the UAE is related to regional security, while in the case of Israel, military cooperation takes a different form to troop or equipment deployment and indirectly benefits from regional missions.
Africa
Africa is the least significant region for the US in terms of global presence, although it is simultaneously identified by the strategic document as the most dynamic and with prospects for improvement. Therefore, the stated aim is to work more closely with both African countries and regional entities. The narrow presence of the US in Africa is concentrated in the Sub-Saharan region, and mainly in the soft dimension. This is due to the significance of indicators related to Development Cooperation and Climate, as the region is home to the least developed countries and the most vulnerable to climate change.
Figure 18. US presence in Africa, by grouping and by dimension (% over the US’s global presence and change 2005-22 in % points)
| % of United States’ global presence, 2022 | Variation 2005-2022, percentage points | |||||||
| Economic | Military | Soft | Global | Economic | Military | Soft | Global | |
| North Africa | 0.1% | 0.0% | 0.2% | 0.3% | -0.1 | 0.0 | 0.0 | -0.1 |
| Subsaharian Africa | 0.2% | 0.3% | 1.7% | 2.2% | -0.1 | 0.3 | 0.5 | 0.6 |
By countries, the strategy highlights the priority of Nigeria, Kenya and South Africa as regional leaders, and countries like Cameroon, the Democratic Republic of Congo, Ethiopia, Mozambique and Somalia due to terrorist concerns. However, the US presence is again scarce in all of them and has not grown since 2005. The increase in military presence has a regional character within the US Africa Command, primarily related to Libya and the movement of jihadists from Syria and Iraq. The exception is the troops deployed in Djibouti, which hosts the only US military base on the continent.
Figure 19. US presence in Africa, by country and by dimension (% over the US’s global presence and change 2005-22 in % points)
| % of United States’ global presence, 2022 | Variation 2005-2022, percentage points | |||||||
| Economic | Military | Soft | Global | Economic | Military | Soft | Global | |
| South Africa | 0.1% | 0.0% | 0.1% | 0.2% | 0.0 | 0.0 | 0.0 | 0.0 |
| Nigeria | 0.0% | 0.0% | 0.1% | 0.2% | 0.0 | 0.0 | 0.1 | 0.1 |
| Ethiopia | 0.0% | 0.0% | 0.1% | 0.1% | 0.0 | 0.0 | 0.0 | 0.0 |
| Congo, DR | 0.0% | 0.0% | 0.1% | 0.1% | 0.0 | 0.0 | 0.0 | 0.0 |
| Kenya | 0.0% | 0.0% | 0.1% | 0.1% | 0.0 | 0.0 | 0.0 | 0.0 |
| Mozambique | 0.0% | 0.0% | 0.0% | 0.0% | 0.0 | 0.0 | 0.0 | 0.0 |
| Cameroon | 0.0% | 0.0% | 0.0% | 0.0% | 0.0 | 0.0 | 0.0 | 0.0 |
Conclusions
In this paper we have analysed the national security strategy of the Biden-Harris Administration through the lens of the Elcano Global Presence Index in order to compare the stated objectives included in the strategic document –in terms of multilateral, regional and bilateral alliances– with the de facto external projection.
The results show the importance of the US’s traditional partners: the G7, the EU and North America. However, the most relevant grouping of countries in the US’s global presence is the G20, which is, however, barely mentioned in the strategy document. There is also a loss of relative weight of these groupings in favour of Asia-Pacific, reflecting the geographical shift of the globalisation process in recent decades. Despite this, the US projection in the EU also increases, even following Brexit –although not with the main European countries, where US projection is reduced–. In sum, Europe as a geographic region absorbs most of the US’s global presence (46.3% in 2022), surpassing even that of the G20. On the opposite side, the US presence is particularly low in Latin America and Africa, with 2.6% and 2.2% in 2022, respectively. In this context, while losing presence in Latin America, and especially military presence in the Middle East, the US has gained soft presence in sub-Saharan Africa.
In 2022 the UK is the main US partner in terms of global presence, followed by Japan, Canada, China and Germany. Since 2005, and despite (or precisely because of) the discourse on the need to contain the rise of the Asian giant, which predominates in the strategy document, the US has significantly increased its projection towards China. The latter is now its fourth destination, with a profile increasingly sustained by the soft dimension and less so by the economic domain. In addition to China, there is a relative increase of the US presence in South Korea and in India, both identified as priority countries in the Biden-Harris strategy. Such a projection seems to crowd-out that in other traditional partners such as Japan, Australia, Thailand and the Philippines.
Methodological Annex
In this exercise of geographical disaggregation of the global presence of the US, we maintain the general structure of the Elcano Global Presence Index, breaking down bilaterally (country by country) each of the indicators that compose it. For more details on the general methodology of the Index, please refer to Olivié & Gracia (2023).[4]
To the extent possible, we have maintained the same criteria for each of the variables and the same data sources used in the general methodology of the Index. However, in some cases, the sources did not offer geographic disaggregation of their data, requiring the use of alternative sources. This has been the case for the variables of migration, tourism, and education, for which national statistical sources have been consulted (see Figure A2).
An exception concerning the original methodology of the Index has also been made for the disaggregation of the military presence. In the Elcano Global Presence Index, this dimension includes the variables of troops deployed abroad and military equipment. In the case of military equipment, the original methodology considers the number of units needed for the movement of troops that each country possesses (aircraft carriers, big ships, destroyers, frigates, nuclear-powered submarines, amphibious ships, medium and heavy strategic airplanes, and air tankers). These units are counted for each country regardless of whether they are deployed abroad at that moment. In the case of the US, it reaches the maximum value for military presence in all the years for which the Index is calculated, with a considerably higher value than the rest of the 149 countries included in the Index calculation. So, for this exercise of ‘bilateralising’ the global presence by geographical destination, we have considered the missions in which the US participates each year, as well as the units present at each overseas base. Therefore, the value recorded by the US in this indicator in the Elcano Global Presence Index has been adjusted to account for the units that were not deployed at the time of the count. Consequently, a percentage of the US’s global presence has not been geographically disaggregated. As Figure A1 shows, the equipment actually deployed by the US accounts for between 4% and 15% of the total equipment possessed, depending on the year. By deducting the remaining equipment and weighting it according to its respective weighting coefficient, we leave undistributed between 12% and 15% of the global presence of the US.
Figure A1. Deployed equipment by the US and undistributed global presence (%)
| 2005 | 2010 | 2015 | 2020 | 2022 | |
| Deployed equipment (% over total equipment) | 4.0 | 9.1 | 11.3 | 14.3 | 16.0 |
| Undistributed global presence (% over global presence) | 15.3 | 15.2 | 14.8 | 13.2 | 12.2 |
On the other hand, some of the original indicators included in the general methodology of the Index do not allow for direct geographic disaggregation, so it has been necessary to resort to alternative proxy variables.
This is the case with the Information indicator, which is divided into two sub-indicators: one related to a country’s presence in the media and the other to its presence on the Internet. The first part could be disaggregated geographically in the same database (Factiva), considering mentions of the US in the media of each country (excluding mentions in the Associated Press). However, for the Internet sub-indicator, measured through the installed bandwidth in a country, it has been necessary to use the number of households with Internet access as a proxy variable. Thus, the value that the US registers in this sub-indicator has been distributed geographically based on the actual Internet access in each country, assuming that in countries with higher access it is possible to have a greater presence in this indicator.
A similar case is that of the presence in the sports indicator, originally measured through a country’s performance in the Olympic medal ranking, the FIFA points for men’s and women’s national teams, and points of football clubs. To distribute the value geographically in this indicator, the number of households with access to TV has been used as a proxy variable. This way, we consider that there is a higher potential for influence in the sports indicator in countries with greater TV access.
In the case of the science indicator, the Global Presence Index methodology considers the number of articles, notes and reviews published in the fields of the arts and humanities, social sciences and science. Given that this variable lacks a direct geographical breakdown, for this exercise we considered the number of publications in co-authorship with an author from another nationality as distribution criteria. Thus, greater scientific cooperation between authors of different nationalities would result in a higher bilateral presence in science.
The climate change indicator was recently included in the overall methodology of the Elcano Global Presence Index.[5] This indicator comprises two sub-indicators, one related to greenhouse gas emissions and the other to the installed capacity of renewable energy in a country. Since neither of them can be disaggregated by geographical destinations, we have once again used a proxy variable for their distribution. In this case, we used the climate vulnerability indicator, included in the GAIN-ND index calculated by the University of Notre Dame.[6] Thus, it is assumed that presence in the climate domain is directly related to the impact that climate change can have on other countries. Therefore, the higher the climate vulnerability, the greater the presence of other countries in this domain.
Figure A2. Indicators and sources used for the geographical breakdown of the US’s global presence
[1] These quotas are calculated as the share of the country’s external projection (global, economic, military or soft) in the aggregate value of presence (global, economic, military or soft) of all 150 countries for which the Index is calculated.
[2] Contributions are defined as the weight of each dimension (economic, military and soft) and variable (from investments to climate change, troops deployed or culture) in a country’s global presence.
[3] Considering exclusively the six countries that, together with the US, form the grouping.
[4] Iliana Olivié & Manuel Gracia (2023), ‘The Elcano Global Presence Index: Methodology’, Working Paper 5/2023, Elcano Royal Institute, Madrid .
[5] For more information, see G. Escribano, M. Gracia, L. Lázaro, I. Olivié & I. Urbasos (2023), ‘Clima y globalización. Propuesta de inclusión de una variable de Cambio Climático en el Índice Elcano de Presencia Global’, ARI nr 51/2023, Elcano Royal Institute, 12/VI/2023.
[6] C. Chen, I. Noble, J. Hellman, J. Coffee, M. Murillo & N. Chawla (2023), University of Notre Dame Global Adaptation Initiative. Country Index Technical Report, University of Notre Dame, January.