

Summary
Spain has paid a high price for an economic model excessively based on construction and real estate. It was hit hard by the bursting of its property bubble following the subprime mortgage crisis in the US in 2008 and the collapse of Lehman Brothers, which intensified the global credit squeeze and triggered the deepest downturn in the world economy since the Great Depression in the 1930s. Unemployment soared, some banks had to be rescued by a euro-zone bail out, the budget deficit and public debt ballooned and the political class became deeply unpopular. The Spanish economy has been in recession almost constantly for five years.
The Popular Party roundly trounced the Socialists in the November 2011 election and since then has taken measures to put the country back on an even keel. The budget deficit is improving, the banking sector is healthier –after a big shake out–, labour market reforms are in place, pension reform is on the table, tax reform is in the pipeline and house prices have plummeted. Net job creation, however, has not yet happened, and the education system is holding back the need to move toward a more knowledge-based economy.
The macroeconomic fundamentals are improving, but the government cannot rest on its laurels and relax the pace of reform. To do so, would store up problems for the future.
Background to the crisis
In order to know where Spain stands today, it is necessary to know where the country came from. The economy roared along for more than a decade like a high-speed train on the country’s extensive network (the world’s second-largest after China), creating wealth, and then shuddered to an almost complete halt before going into reverse.
GDP expanded by an annual average of 3.8% between 1999 and 2003 and by 3.1% between 2004 and 2008, compared with euro-zone growth of 2% and 2.1%, respectively. The unemployment rate dropped from an annual average of almost 19% between 1994 and 1998 to 9.6% in 2004-08, while per capita income rose from 91% of the average for the 27 EU countries in 1996 to 101% in 2004 and a peak of 105% in 2007 (higher than Italy). The economic bonanza generated a surge in fiscal receipts and resulted in a budget surplus of close to 2% of GDP in 2007 and a reduction in the level of public debt to 36.3% of GDP.
Much of the growth, however, was illusory, as it was driven, among other factors, by an unsustainable and lopsided economic model, excessively based on the shaky foundations of the construction and property sectors. The number of housing starts rose from 131,280 in 1999 to 762,214 in 2006, the peak year of the residential boom, reportedly more than Germany, France and Italy combined. House prices almost trebled between 1997 and early 2008. Spain accounted for an estimated 30% of all new homes built in the EU between 2000 and 2009, although its economy only generated around 10% of the Union’s total GDP.
There were four main reasons for the construction boom and the spending binge in general. First, interest rates were very low after Spain adopted the euro in 1999. They fell from 14% (with the peseta) to 4% (with the euro) in a matter of weeks and continued to fall. In setting them, the European Central Bank was mainly guided by the economic environment in Germany and France, the largest economies. The Bank of Spain, however, has instruments to prevent a credit explosion, such as tighter rules for mortgages. This one-size-fits-all monetary policy was not suited to Spain. As its inflation rate was higher, interest rates there were often close to zero in real terms. This encouraged Spaniards to take out loans for mortgages, which were further stimulated by the tax breaks for buying a home, and corporates to acquire companies and assets abroad. Spanish and foreign banks fell over themselves to provide finance and offered up to 110% loans for 40 years. German banks, in particular, funded those Spanish banks that needed extra financing for their loans. Second, property was viewed as a good investment in a country where home ownership was 85% (compared to a euro-zone average of 60%) and a significant number of people have a second home (usually an apartment on the coast or a house in a village). House price rises averaged 12% a year during most of the 2000s and speculative investors made a killing before the collapse of the market. Third, foreign demand for holiday and retirement homes. The euro eliminated foreign exchange risks for expats in terms of the value of their pensions and properties. Fourth, the regionally based and unlisted savings banks (cajas, similar to savings and loan institutions in the US) were closely connected to politicians, trade unions and businessmen in the areas where they operated and property developers had vested interests in pushing property for all it was worth.
Other factors behind the crisis in Spain were the failure of the rating agencies, the economic theory of rational expectations (markets always price assets right) and BIS rules regarding measurement of risk in banks, which ignored the possibility of ‘black swans’ and illiquid markets.
Municipal authorities benefited from the reclassification of land for building purposes as this increased their revenue (paltry from other sources), while building that took place on vacant land of a certain size entitled town halls to take possession of 10% of the land, which was then often sold back to the developer. This practice was fertile ground for corruption. Spaniards joked at the time that the easiest way to become a millionaire was to become a mayor. In 2006, at the peak of its economic boom, Spain accounted for one-quarter of the total number of 500 euro notes in circulation in the then 12 euro-zone countries –much higher than what should correspond to the country’s economic size (around 10% of the zone’s GDP)–. Ordinary Spaniards referred to these notes, used in large informal economy transactions, as ‘bin Ladens’ (in reference to Osama bin Laden, the founder of al-Qaeda) because everyone knew they existed and what they looked like but had never seen them.
At the height of the boom, the construction and property sectors and related services accounted for 18% of GDP, 20% of employment and a disproportionate share of tax revenue that plummeted when the real-estate bubble burst. The proportion of investment in construction reached 22% of GDP in 2006-07, up from 15% in 1995. This represented a significant diversion of productive resources from the tradable sector to the non-tradable construction sector. Such an economic model was not sustainable and was, to borrow the title of a novel by Gabriel García Márquez, a Chronicle of a Death Foretold or perhaps to be fairer, Chronicle of a Failure Foretold. Too much of the economy was built, literally, on bricks and cement and too little on knowledge and tradable or export-oriented industry.
Credit to the private sector at the height of the boom increased at an annual average of 23% between 2004 and 2007. Spain accounted at one stage for one quarter of the euro zone’s total lending. Furthermore, the growth in credit was not balanced across the various sectors of the economy, but was concentrated in the real estate sector. Loans relating to real estate purchases, development and construction in 2007 accounted for 62% of bank financing to the private sector. The gross debt of households and non-financial corporations doubled to a whopping 227% of GDP between 2000 and 2010, leaving the Spanish private sector amongst the most indebted in the EU. The household debt-to-GDP ratio more than doubled between 2000 and 2010 to 86% of GDP. This accumulation of debt by the private sector led to an increase in the Spanish net debit position vis-à-vis the rest of the world, which in 2011 stood at 92% of GDP, and Spanish debt was underpriced. This figure was close to that exhibited by Greece, Portugal and Ireland, all of them around 100% and all of them bailed out by the EU between 2010 and 2011. Countries such as France, Italy, the UK and the US showed net debit positions against the rest of the world of between 10% and 20% of their GDP. At the other extreme, Germany and the Netherlands had net asset positions in relation to the rest of the world of around 35% of their GDP. The current account deficit reached 10% of GDP in 2007, underscoring the extent to which the economy had become overheated and uncompetitive, and Spaniards were living way beyond their means and on borrowed money.
The boom began to crumble after the first signs of a global credit crunch in August 2007, following the subprime mortgage crisis in the US, and particularly after September 2008 and the collapse of Lehman Brothers, which intensified the credit squeeze and triggered the deepest downturn in the global economy since the Great Depression in the 1930s.
The Socialist government of José Luis Rodríguez Zapatero (2004-11) was initially in denial over the crisis. It was not until May 2010, by when the EU had agreed a bailout of the Greek economy in the forlorn hope that this would stem the euro zone’s existential crisis, that Rodríguez Zapatero engineered a U-turn in his economic policy and implemented austerity measures. By then the unemployment rate was fast rising to 20% (8.3% in 2007), the budget deficit had ended 2009 at a whopping 11.2% of GDP (1.9% surplus in 2007), due more to plummeting tax receipts as a result of the bursting of the property bubble and to a lesser extent to public spending out of control, and public debt reached 54% of GDP (36.3% in 2007). The economy shrank by close to 6% between 2007 and 2013 (see Figure 1).
Figure 1. GDP in constant prices, 2007-13 (€ billion)
| 2007 | 2013 (1) | % change 2007/13 | |
| France | 1,800 | 1,800 | 0.0 |
| Germany | 2,385 | 2,484 | +4.1 |
| Italy | 1,493 | 1,369 | -8.3 |
| Spain | 1,078 | 1,017 | -5.6 |
(1) Forecasts.
Source: IMF, April 2013.
The government’s measures included a cut in the salaries of 2.8 million civil servants, a freeze on payments for 9 million pensioners and cuts in investment, combined with a hike in VAT from 16% to 18% and labour market reforms.
The impact of the crisis
(3.1) On the labour market: soaring unemployment
No other EU country has swung in such a short a period from intense job creation to massive job destruction as Spain. The number of people employed, according to the quarterly labour force survey, dropped from a high of 20.45 million in 2007 at the peak of the boom, to16.78 million in June 2013, a loss of 3.67million jobs. The largest number of job losses (1.66 million) was in the construction sector, the engine of the economy (see Figure 2). Added to those actively looking for work, the total number of jobless officially reached 5.97 million in June. The jobless rate surged from 8.6% at the end of 2007 (regarded at the time as a level approaching full employment) to 26.3% in July 2013, more than double the EU average and by far the biggest increase in the EU and among OECD countries over the past five years (see Figure 3).
Figure 2. Employment in Spain by sectors, 2007-13 (1) (million jobs)
| 2007 | 2008 | 2009 | 2010 | 2011 | 2012 | 2013* | |
| Services | 13.59 | 13.83 | 13.38 | 13.40 | 13.19 | 12.71 | 12.69 |
| Industry | 3.27 | 3.04 | 2.68 | 2.62 | 2.52 | 2.38 | 2.29 |
| Construction | 2.69 | 2.18 | 1.80 | 1.57 | 1.27 | 1.07 | 1.03 |
| Agriculture | 0.90 | 0.80 | 0.78 | 0.80 | 0.80 | 0.78 | 0.76 |
| Total jobs | 20.45 | 19.85 | 18.64 | 18.40 | 17.80 | 16.95 | 16.78 |
(1) June.
Source: INE, based on labour force survey.
Figure 3. Seasonally-adjusted unemployment rates (%), selected EU Countries
| 1999-2003 average | 2004-0average | 2009 | 2010 | 2011 | 2012 | 2013 (1) | |
| France | 9.0 | 8.8 | 9.5 | 9.7 | 9.6 | 10.3 | 11.0 |
| Germany | 8.6 | 9.7 | 7.8 | 7.1 | 5.9 | 5.5 | 5.2 |
| Italy | 9.0 | 8.8 | 9.5 | 9.7 | 9.6 | 10.3 | 12.2 |
| Spain | 11.6 | 9.6 | 18.0 | 20.1 | 21.7 | 25.0 | 26.2 |
| UK | 5.3 | 5.2 | 7.6 | 7.8 | 8.0 | 7.9 | 7.7 |
| EU | 8.9 | 8.2 | 9.0 | 9.7 | 9.6 | 10.5 | 10.9 |
(1) August except for the UK which is June.
Source: Eurostat.
The depth of Spain’s employment crisis was such that the country, with around 11% of the euro zone’s GDP and a population of 47 million, accounted for close to one-third of the zone’s million total jobless, whereas Germany (with a population of 82 million and 30% of the GDP) accounted for around 15% of the unemployed. Spain’s seasonally-adjusted jobless rate is almost five times Germany’s rate of 5.3%, the lowest since reunification in 1991, and it was forecast to remain at around 25% until 2016. Germany not only has a more flexible labour market, including the kurzabeit system, under which companies agree to avoid laying off workers and instead reduce their working hours, with the government making up some of the employees’ lost income, but, equally if not more important, a much more diversified and export-oriented economic model capable of creating jobs on a sustained basis.
The stated jobless rate among immigrants –many of whom were attracted to Spain by the construction boom– was 35.7% in June 2013, 11 pp higher than that for Spaniards. Between 2002 and 2007 the number of jobholders rose by 4.1 million, a much steeper rise than in any other EU country and only 1.2 million less than the increase between 1986 and 2002. Youth unemployment was even more acute at a staggering56%, but including at least in part those in training and education, which better reflects reality, it is much lower at around 23%.[2] The number of households where no member was working rose from 380,000 in 2007 to 1.8 million in June 2013, and the number of unemployed aged between 50 and 65 shot up over the same period from 264,000 to 1.1 million. The regional divide in unemployment also widened considerably (see Figure 4).
Figure 4. Stated unemployment rates by regions and the cities of Ceuta and Melilla (%) (1)
| % | % | ||
| Andalusia | 35.8 | Ceuta | 35.0 |
| Aragón | 21.9 | Extremadura | 33.7 |
| Asturias | 24.4 | Galicia | 22.4 |
| Balearic Islands | 21.0 | La Rioja | 20.7 |
| Basque Country | 15.4 | Madrid | 19.5 |
| Canary Islands | 33.7 | Melilla | 28.7 |
| Cantabria | 22.3 | Murcia | 29.1 |
| Castile-León | 21.3 | Navarra | 18.3 |
| Castile-La Mancha | 30.1 | Valencia | 29.0 |
| Catalonia | 23.8 | Spain | 26.3 |
(1) June 2013.
Source: INE, based on labour force survey.
The surge in unemployment was in large measure due to the bursting of the housing bubble and the consequent downsizing of the construction sector. Other countries, however, have had bubbles that have burst, such as the US, Ireland and the UK, but they did not have the same devastating impact as Spain’s. The overly rigid labour market, particularly the lack of flexibility at the company level coupled with a system of dual employment protection resulted in a massive dismissal of mostly temporary workers. ‘The structure of the labour market means that when bad economic times hit, firms have to adjust by sacking temporary workers rather than by changing working conditions, including wages’, said James Daniel, the IMF mission chief for Spain, in July 2012. ‘This way of doing things disproportionately affects young workers. In the rest of the world they do a bit of both, hiring and firing, but also changing working conditions and adjusting wages’.[3] During its recession, Spain had the developed world’s highest Okun coefficient (ie, the greatest sensitivity of employment to changes in the GDP).
The share of the workforce on these precarious temporary contracts shot up from around 12% before the two-tier 1984 labour market reform to 33% at the peak of the economic boom (23.1% in June 2013). This created a dual labour market split between insiders (those in a relatively privileged situation on permanent contracts) and outsiders (those on fixed-term contracts).
Many young people, especially males, left school early during the boom period to work, particularly in the construction and real estate sectors and usually on short-term contracts. The early school-leaving rate (the proportion of 18-24-year olds with only lower secondary school qualifications at best and not in professional training courses) reached 36% among young males in 2008, more than double the EU average, although with big differences by regions. In 2012 it had dropped to 29% as young people had little option but to carry on studying (see Figure 5). The overall rate (including women) stood at 25%, down from 21% in 2007.
Figure 5. Early male leavers from education and training (%), selected countries
| 2007 | 2012 | |
| Spain | 36.1 | 28.8 |
| Italy | 22.6 | 20.5 |
| EU-27 | 16.9 | 14.5 |
| UK | 14.6 | 14.6 |
| France | 14.6 | 13.4 |
| Germany | 13.4 | 11.1 |
| Poland | 6.4 | 7.8 |
Source: Eurostat.
(3.2) On the banking sector: a euro zone bail out
José Luis Rodríguez Zapatero, the former Prime Minister, told a meeting of Wall Street bankers in New York, nine days after the collapse of Lehman Brothers in September 2008, that ‘Spain has perhaps the most solid financial system in the world. It has a standard of regulation and supervision recognized internationally for its quality and rigour’. The Bank of Spain (the central bank) had introduced in 2000 a prudent policy of counter-cyclical provisions which created a cushion during the upward phases of an economic cycle in order to soften the impact of bad loans on banks’ earnings during periods of lower growth when defaults are higher.
But when the Spanish economy went into recession in 2009 as a result of the bursting of the massive property bubble it had a devastating impact on banks, especially savings banks (known as cajas), as many of them were far too heavily exposed to the construction and real estate sectors. These toxic real-estate assets were Spain’s equivalent of US subprime mortgages (to which Spanish banks were not exposed). The loan defaults of property developers and construction firms as a percentage of total bank lending to these two sectors surged from a mere 0.6% in 2007 to 28% at the end of 2012, as of when it has stabilised. The total amount of non-performing loans represented a record 11.6% of lending to all sectors in June 2013 (excluding the toxic loans placed in a specially created ‘bad bank’ known as Sareb), up from 0.9% in 2007.
The banking crisis was concentrated in the regionally-based savings banks, which accounted for around 50% of the domestic banking system’s assets. The 45 cajas were much harder hit by loan defaults than Spain’s commercial banks, including the big two, Santander, the euro zone’s largest by market capitalisation, and BBVA because of the savings banks’ bigger relative exposure to the construction and property sectors. Similar to the German model, the cajas were not limited companies and so did not have share capital. As a result, they were not subject to typical market discipline mechanisms. They were governed by a general assembly and boards of directors packed with political appointees, local businessmen (often with links to politicians) and some savers. After restrictions were removed in 1989 on setting up branches outside their home regions, the savings banks expanded aggressively and recklessly around Spain. This contributed to the build-up of excess capacity and risk concentration in the financial system. The number of their branches rose from 13,650 in 1990 to a peak of 25,035 in December 2008, while the number of branches of the much more prudent commercial banks dropped over the same period from 17,075 to 15,617. Between 1990 and 2002, the total number of branches rose from 35,234 to 38,673 and between 2002 and 2008 by almost 7,000 to 45,662. There was almost one branch for every 1,000 inhabitants in Spain in 2009, almost twice the density of the euro-area average. The cajas also took stakes in companies.
The first savings bank to fall was Caja Castilla La Mancha (CCM) in March 2009, when the Bank of Spain took over its administration. Among other reckless projects, CCM had provided finance for the building of the white-elephant airport at Ciudad Real. Its seizure was the first bank rescue in Spain in 16 years. Mergers, interventions and take-overs of ailing savings banks under moral suasion by the Bank of Spain (the central bank), including the creation of Bankia from seven struggling cajas at the end of 2010, the fourth-largest bank and the biggest real-estate lender, reduced the total number of savings banks from 45 to 11 by the end of 2012 in an ongoing process.
Bankia was floated on the stock market in 2011 and nationalised in 2012 as a result of the unsustainable weight of its unpaid property loans. Bankia made Spanish corporate history with a loss of €25.2 billion in 2012. The depth of Bankia’s crisis was such that Miguel Ángel Fernández Ordóñez, the Governor of the Bank of Spain, feared that it could force Spain out of the euro zone. The total losses of consolidated banking groups were €55.6 billion in 2012 compared with a loss of €1.5 billion in 2011 and profits of €20.2 billion in 2009. The return on average total assets in 2012 was 1.39% negative (0.54% positive in 2009).
In testimony he gave in May 2013 to a judge in relation to a probe into Bankia’s crisis, Fernández Ordoñez questioned the ability of Rodrigo Rato, a former economy supremo in the Popular Party’s governments (1996-2004) and managing director of the IMF (2004-07), to run the banking group and criticised the PP’s decision to appoint him. Empirical evidence shows that savings banks whose chairman was a political appointee and, in many cases, lacked proper banking experience, performed significantly worse.[4] Fernández Ordoñez, himself a former Socialist Secretary of State for the Economy, bowed out one month before his term was up and was replaced in June 2012 by Luis Linde, a veteran central banker.
The Comptroller General’s Office later criticised the Bank of Spain for its ‘softened’ supervision reports on Bankia and, in particular, on Caja Madrid as the reports ‘did not reflect the problems in all their crude reality’. As part of the banking reforms demanded by the troika, the discrepancies of central bank inspectors, which arise when assessing the health of a bank, will be made known to the top management and in writing. Inspectors said evaluations in the past were toned down by middle management before they reached the top.
‘In the real estate and financial bubble years there was a sort of euphoria which led to the risks that were accumulating to not be seen, or not wish to be seen’, said Linde. ‘It was as if nobody wanted to forecast scenarios of recession, interest-rate rises or collapses in funding’.
(3.3) On public accounts: a ballooning deficit
Equally dramatic was the impact of recession on the general government budget balance and on public debt, both of which deteriorated dramatically and at a fast pace. The budget balance deteriorated from a surplus of 1.9% of GDP in 2007 to a deficit of 11.2% in 2009, the largest fall after Ireland (from 0.1% to -13.9%), one of the three countries rescued by the EU along with Greece and Portugal when the sovereign debt crisis blew up in 2010 (see Figure 6).
Figure 6. General government balance (% of GDP), 2007-13
| 2007 | 2008 | 2009 | 2010 | 2011 | 2012 | 2013 (f) | |
| France | -2.7 | -3.3 | -7.5 | -7.1 | -5.3 | -4.8 | -3.9 |
| Germany | 0.2 | -0.1 | -3.1 | -4.1 | -0.8 | 0.2 | -0.2 |
| Italy | -1.6 | -2.7 | -5.5 | -4.5 | -3.8 | -3.0 | -2.9 |
| Spain | 1.9 | -4.5 | -11.2 | -9.7 | -9.4 | -10.6 (1) | -6.5 |
| Euro zone | -0.7 | -2.1 | -6.4 | -6.2 | -4.2 | -3.7 | -2.9 |
(f) Forecast.
(1) 7% net of capital transfers to recapitalise banks. The government lowered this figure to 6.8% at the end of September 2013, but gave no further details.
Source: Eurostat.
Spain’s healthy fiscal situation before the crisis was used to pay down debt. The Socialist government reduced the level from 55.6% of GDP in 2001 to 36.3% in 2007 when it was by far the lowest among the big euro zone economies and almost half that of Germany (see Figure 7). Debt quickly rose when tax revenues plummeted as of 2007 (see Figure 8) and public spending increased (see Figure 9).
Figure 7. Gross public debt (% of GDP), 2007-13
| 2007 | 2008 | 2009 | 2010 | 2011 | 2012 | 2013 (f) | |
| France | 64.2 | 68.2 | 79.2 | 82.4 | 85.8 | 90.2 | 94.0 |
| Germany | 65.2 | 66.8 | 74.5 | 82.4 | 80.4 | 81.9 | 81.1 |
| Italy | 106.3 | 103.3 | 116.4 | 119.3 | 120.8 | 127.0 | 131.4 |
| Spain | 36.3 | 40.2 | 53.9 | 61.5 | 69.3 | 84.2 | 91.3 (1) |
| Euro zone | 66.4 | 70.2 | 80.0 | 85.4 | 88.0 | 92.7 | 95.5 |
(f) Forecast.
(1) It was 92.2% in June.
Source: Eurostat.
Figure 8. Total tax burden including imputed social security contributions (% of GDP at market prices, excessive deficit procedure)
| 2007 | 2008 | 2009 | 2010 | 2011 | 2012 | |
| France | 45.2 | 45.0 | 44.1 | 44.5 | 45.7 | 46.9 |
| Germany | 40.0 | 40.2 | 40.8 | 39.3 | 40.0 | 40.8 |
| Italy | 43.0 | 43.0 | 43.2 | 42.8 | 42.8 | 44.3 |
| Spain | 38.0 | 33.8 | 31.6 | 33.1 | 32.4 | 33.0 |
| Euro zone | 41.2 | 40.8 | 40.4 | 40.3 | 40.7 | 41.7 |
Source: Eurostat.
Figure 9. General government expenditure (% of GDP at market prices, excessive deficit procedure)
| 2007 | 2008 | 2009 | 2010 | 2011 | 2012 | |
| France | 52.6 | 53.3 | 56.8 | 56.5 | 55.9 | 56.6 |
| Germany | 43.5 | 44.1 | 48.2 | 47.7 | 45.3 | 44.6 |
| Italy | 47.6 | 48.6 | 51.9 | 50.5 | 49.9 | 50.6 |
| Spain | 39.2 | 41.5 | 46.3 | 46.3 | 45.1* | 48.0* |
| Euro zone | 46.0 | 47.1 | 51.2 | 51.0 | 49.5 | 49.9 |
(1) Including aid to banks. Without this, the respective figures are 44.6% and 43.4%.
Source: Eurostat.
The whopping budget deficit in 2009 was due to the nosedive in tax revenues and sustained public spending, particularly in health and education. Even at the peak of its economic boom, Spain’s tax revenues, including social security contributions, only represented 38% of GDP, the lowest among the four largest euro-zone economies, and they dropped to 32.4% in 2011 before beginning to rise in 2012 as a result of tax hikes, particularly in VAT. In contrast, the tax revenue levels of France, Germany and Italy remained largely unchanged if not slightly higher between 2007 and 2011.
Total government revenue (tax receipts plus other items such as income from capital and EU transfers) dropped from a high of 41.1% of GDP in 2007 to 36.4% in 2012 (up from 35.7% in 2011) and almost 10 points below the euro-zone average. This level was the lowest in the euro zone after Ireland (34.6%) and Slovakia (33.1%). Only two euro-zone countries recorded a bigger fall during this period –Ireland and Greece– and both of them were bailed out by the EU.
The rapid deterioration of the budget deficit and the perception of the dangers inherent in a growing feedback loop between sovereign risk and banking risk worsened, pushing up sovereign debt yields to their highest levels since the creation of the euro zone (7.5% on the 10-year Spanish government bond at the end of July 2012). Yields at this level in Greece, Portugal and Ireland triggered EU bailouts. The risk premium on government bonds –the difference between Spain’s 10-year bond yields and those of low-risk Germany– rose briefly to more than 650 basis points, from an average of 8 basis points in 2007.
(3.4) On migration: a turnaround
Spain’s economic boom attracted an influx of immigrants from Europe, Latin America and North Africa, particularly in the construction sector. When the economy went into recession in 2009, the 5.6 million foreigners in Spain, excluding naturalised Spaniards, accounted for 12.1% of the total population, up from 1.3 million people (3.3%) in 2001.[5] These people have been successfully absorbed into a society that even only a decade ago was largely homogeneous; Spain does not have a problem of immigrant ghettos (like France) or a xenophobic extreme right-wing political party.
Spain went from being a net exporter of people –in the 1950s and 1960s several million emigrated to Latin America and northern Europe– to the largest recipient of immigrants in the EU in the shortest period. The population increased by 6 million between 2001 and 2011, the largest growth ever in a decade in the country’s history, 3.6 million of whom were foreigners, mostly of working age and mainly from Rumania and Morocco (see Figure 10). Their arrival changed the face of Spain (see Figure 11).
Figure 10. Spain’s population and foreigners’ share, 2001-12
| 2001 | 2003 | 2006 | 2007 | 2008 | 2009 | 2010 | 2011 | 2012 | 2013 (1) | |
| Population (mn) | 41.1 | 42.7 | 44.7 | 45.2 | 46.1 | 46.7 | 47.0 | 47.2 | 47.3 | 47.1 |
| Foreigners’ share (%) | 3.3 | 6.2 | 9.3 | 10.0 | 11.4 | 12.1 | 12.2 | 12.2 | 12.1 | 11.7 |
Note: the figures at 1 January of each year are based on those registered with local town halls and are rounded to the nearest decimal point. Foreigners have an incentive to register as it entitles them to public health care and education, although not everyone does so. Failure to register leaves individuals with no legal recourse and no access to state services or aid. These figures exclude naturalised Spaniards.
(1) Provisional figures.
Source: INE.
Figure 11. Foreign population by the top-10 countries of origin, 2007 and 2013
| 1 January 2007 (1) | % of total | 1 January 2013 | % of total | |
| Rumania | 524,995 | 11.7 | 868,635 | 15.7 |
| Morocco | 576,344 | 12.8 | 787,013 | 13.7 |
| UK | 314,098 | 7.0 | 383,093 | 6.9 |
| Ecuador | 421,384 | 9.4 | 262,223 | 4.8 |
| Colombia | 258,726 | 5.7 | 221,361 | 4.0 |
| Italy | 134,712 | 3.0 | 192,147 | 3.5 |
| Germany | 163,887 | 3.6 | 181,320 | 3.3 |
| China | 104,997 | 2.3 | 180,648 | 3.3 |
| Bolivia | 198,770 | 4.4 | 172,412 | 3.1 |
| Bulgaria | 121,611 | 2.7 | 168,631 | 3.1 |
| Other countries | 2,819,524 | 37.4 | 2,102,650 | 38.0 |
| Total | 5,639,048 | 100.0 | 5,520,133 | 100.0 |
(1) Provisional figures and excluding naturalised Spaniards in both years.
Source: INE.
This flow was reversed in 2012 when the population declined (by more than 200,000) for the first time since the regular census began in 1996 as a result of net migration. The drop was mainly due to emigrants from Latin America fleeing the recession. The jobless rate of foreigners at the end of 2012 was 36.5% compared with 24.2% for natives.
Spaniards are also emigrating, particularly to thriving Germany where close to 30,000 moved in 2012, according to German statistics. This was 45% more than in 2011 and roughly the same number as in 1973 when the Spanish economy was also in crisis, but nothing compared to the migration from Poland to Germany in 2012 (176,000). However, the total number of Spanish residents in Germany at the end of 2012 was only 13,000 higher than in 2009, at 116,000, suggesting that while some arrived others returned to Spain. According to the registry of Spaniards resident abroad (known as PERE) and data in countries where Spaniards reside, the number of Spaniards officially recorded as living in other countries increased by only 40,000 (+6%) between January 2009 and January 2013 (less than 0.1% of Spain’s population) to a total of 1.9 million (considerably less than the 6.4 million foreign-born citizens living in Spain including naturalised Spaniards). The 40,000 figure excludes the very many who move abroad to find a job and then return home, and it belies the impression given in the Spanish press of a mass exodus.[6] Spanish society has, in fact, been exceptionally immobile over the last 30 years.
(3.5) On the political class: deeply unpopular
Spain’s political class, particularly the Popular Party (PP) and the Socialists, the two main parties, bears a large degree of responsibility for Spain’s economic, financial and banking crises that were superimposed on one another like Russian nesting dolls. Political parties have colonised state institutions, preventing an effective system of checks and balances that would have gone some way toward reducing the scale of the crises. As a result, politicians are regarded as part of the problem and not the solution.
Spain, however, is far from being the only country where confidence in politicians and in institutions has declined (see Figure 12).
Figure 12. Confidence in Institutions (% of citizens who, in each country, positively view each of these institutions)
| Spain | France | Italy | US | |
| Political institutions | ||||
| The king/president | 50 | 31 | 45 | 36 |
| The parliament | 28 | 24 | 9 | 10 |
| The government | 26 | 21 | 16 | – |
| Political parties | 12 | 12 | 7 | – |
| Economic institutions | ||||
| SMEs | 90 | 75 | – | 65 |
| Large companies | 46 | 45 | – | 22 |
| Banks | 15 | 25 | 23 | 26 |
| Other institutions | ||||
| State schools | 85 | 73 | 48 | 32 |
| Police | 83 | 66 | 74 | 57 |
| Voluntary associations | 75 | 69 | 75 | – |
| Health systems | 73 | 82 | 54 | 35 |
| Armed forces | 72 | 73 | 71 | 76 |
| Public administrations | 70 | 57 | 18 | – |
| Magistrates | 50 | 58 | 43 | – |
| Roman Catholic Church (1) | 41 | 31 | 37 | 48 |
| Trade unions | 28 | 35 | 20 | 20 |
(1) In the US, ‘organised churches’.
Sources: for Spain, Metroscopia, July 2013; for France, CEVIPOF-opinion-way, 2013; for Italy, EURISPES 2013 report; and for the US, Gallup 2013.
In the case of savings banks, the influence of local politicians and businessmen associated with them led the cajas to shower the real estate sector with reckless loans. This crony capitalism and spoils system caused immense economic damage.
Politicians, parliament and the political class in general were regularly ranked at the bottom of the barometer of confidence in institutions and social groups drawn up by Metroscopia (scientists and doctors headed it). Spain’s position in the World Economic Forum’s ranking of public trust in politicians –part of the Global Competitiveness Index– dropped from 79th in the 2012-13 index to 101st in the 2013-14 index. The political class is viewed as a caste and an extractive elite.
According to newspaper estimates, in the 13 years to 2013 –a boom period for the economy– there were around 800 corruption cases, most, but not all, under judicial investigation, and close to 2,000 people were arrested, few of whom, however, were imprisoned. Almost all political parties were accused of corruption and also a significant number of companies, mainly construction firms. The most serious case was the slush-fund scandal involving Luis Bárcenas, the PP’s former national treasurer, who was jailed in June 2013 until his trial starts and denied bail because he was considered a flight risk. He was accused of amassing a fortune of €48 million in Swiss bank accounts. Bárcenas said cash was delivered to the PP in suitcases in return for contracts and favours for businessmen. In the region of Andalusia, the Socialists’ fiefdom, current and former officials of the region’s administration were under investigation for fraudulent use of public funds used to pay bogus early-retirement compensation for up to 100 people. The funds involved in this case are not only public but much larger than in the Bárcenas case.
Corruption became more widespread during the boom period but it never reached Italian proportions, as can be seen from the Berlin-based Transparency International’s Corruption Perceptions Index, which measures perceptions of public sector corruption. Spain was ranked 30th and Italy 72ndout of 176 countries in the 2012 index (see Figure 13). Most corruption involves politicians, but very rarely civil servants.
Figure 13. Corruption Perceptions Index, selected countries
| Country Ranking | Score |
| 1. Denmark | 90 |
| 13. Germany | 79 |
| 17. UK | 47 |
| 22. France | 71 |
| 30. Spain | 65 |
| 72. Italy | 42 |
| 174. Somalia | 8 |
Source: Transparency International, 2012 Corruption Perceptions index.
As a result of the crisis, Spain has seen a huge change in public attitudes to corruption. Anger at corruption led to protestors waving loaves above their heads and shouting: ‘There isn’t enough bread for so many chorizos!’. A chorizo is a spicy sausage, often sliced and served in a sandwich, and is also the slang for a swindler or cheat.
This change is a long overdue and healthy phase in Spain’s transition from General Franco’s authoritarian state to democratic accountability. Political reform is badly needed, particularly of the closed-list system in elections that gives so much power to a party’s apparatus at the expense of accountability, and makes politicians at all levels subservient to their leaders. Spain also has one of the least-open governments in the developed world, though this looked like finally beginning to change, as a result of a long overdue transparency law, although the Spanish branch of Transparency International said it fell short of what was needed.
Spanish politicians very rarely accept their responsibilities and resign. Spaniards were gobsmacked when Chris Huhne, the former Liberal Democrat minister, resigned from his seat in parliament this year after he pleaded guilty to perverting the course of justice over a ‘petty’ speeding case involving his then wife who agreed to take his speeding points. He was jailed for eight months. Nothing like that would happen in Spain, where hardly any politician accepts his responsibilities, and for much more serious cases.
The two-party system looks like giving way to four parties if the results of voting intention polls are the same on the actual polling day (see Figure 14). Whether this will be a one-off development or a permanent feature of the Spanish political landscape remains to be seen. The next general election is not due until November 2015. According to these results, both the PP and the Socialists would be a long way off from winning an absolute majority and between them would only capture around 60% of the vote, down from 73% in November 2011. This outcome, however, is predicated on a voter turnout of 62%, which is low by Spanish standards (68.9% in 2011 and 71.7% in 2008).
A lot could happen by the time of the next election to change this. For a start, a new and much younger Socialist leader will be elected before 2015 in place of Alfredo Pérez Rubalcaba, who could reinvigorate a party on whose watch the crises started. The 61-year-old Pérez Rubalcaba is too identified with the party’s old guard. The economy could also show sufficient ‘green shoots’ to boost support for the PP. Be that as it may, the prospect of a coalition government, for the first time since the Second Republic (1931-39), should not be discounted or viewed negatively as it would force greater consensus in political life, an element that has been sadly lacking.
Figure 14. Results of general elections, 1979-2011 (% of total votes)
| 1979 | 1982 | 1986 | 1989 | 1993 | 1996 | 2000 | 2004 | 2008 | 2011 | 2013 (1) | |
| UCD (centrist) (2) | 35.0 | – | – | – | – | – | – | – | – | 4.7 | 9.0 |
| Socialists | 30.5 | 48.3 | 44.1 | 39.6 | 38.8 | 37.6 | 34.7 | 42.6 | 43.6 | 28.7 | 30.5 |
| Communists (3) | 10.8 | 4.0 | 4.6 | 9.1 | 9.6 | 10.5 | 5.5 | 4.9 | 3.8 | 6.9 | 11.6 |
| Conservatives (4) | 6.0 | 26.5 | 26.0 | 25.8 | 34.8 | 38.8 | 45.2 | 37.6 | 40.1 | 44.6 | 30.1 |
| Catalan (5) | 2.7 | 3.7 | 5.0 | 5.0 | 4.9 | 4.6 | 4.2 | 3.2 | 3.0 | 4.1 | NA |
| Basque (6) | 1.5 | 1.9 | 1.5 | 1.2 | 1.2 | 1.3 | 1.5 | 1.6 | 1.2 | 1.3 | NA |
| Other | 13.5 | 15.6 | 18.8 | 19.3 | 10.7 | 7.2 | 8.9 | 10.1 | 8.3 | 15.9 | NA |
(1) Voting intention results, September 2013, according to Metroscopia. Based on a voter turnout of 62%.
(2) Progress and Democracy Union (UPyD) as of 2008.
(3) Spanish Communist Party, known as United Left as of the 1986 election.
(4) Popular Alliance, known as the Popular Party as of the 1989 election.
(5) Centre-right Democratic Agreement for Catalonia, known as Convergence and Union as of the 1979 election.
(6) Centre-right Basque Nationalist Party.
The main beneficiaries of the plummeting support for the PP and the Socialists would be the United Left and the centrist Progress and Democracy Unión (UPyD), which would both substantially increase their number of seats in parliament. Their increased support, however, does not account for all of the main parties’ loss of support and points to a significant increase in abstention.
The ingredients and the opportunities exist for a populist party to enter the political arena. Voters, mostly young adults, disillusioned with the political class in general have formed a bubble of social rage and alienation, whose most visible expression was the creation in May 2011 of an ‘indignant’ protest movement which began with a spontaneous sit-in in the Puerta de Sol square in the centre of Madrid. Since then, however, no new and well organised group or leader has emerged capable of channelling the disenchantment with what is perceived as a political caste into a viable political alternative.
Spain, thankfully, does not have the equivalent of Italy’s Beppe Grillo, nor does it have extreme right-wing or anti-EU parties, unlike a growing number of European countries. The lack of an extreme right-wing party could be one of the good legacies of the Franco dictatorship (1939-75). A majority of Spaniards still define themselves in political self-placement scales as in the centre, and around 60% believe that ‘despite all its defects and shortcomings, the current democracy constitutes the best period in our country’s history’. Spaniards are discontented with the way the EU works, but support for the euro remained strong in 2013 (see Figure 15).
Figure 15. Support for the euro (%)
| Return to own currency | Keep the euro | |
| Greece | 25 | 69 |
| Spain | 29 | 67 |
| Germany | 32 | 66 |
| Italy | 27 | 64 |
| France | 37 | 63 |
Source: Pew Research Center, May 2013.
(3.6) On the country’s human development: living standards decline
As one would expect, five years of recession and a surge in unemployment generated a social crisis. Per capita income dropped from US$31,560 in 2007 to US$25,947 in 2012 in purchasing power parity terms, according to UN development reports. This was the first sustained drop in GDP per head since the end of the 1950s. While not belittling the scale of the social crisis, such a crisis is not the same in a country with a per capita income of US$26,000 and a developed welfare system (albeit one under strain), which is Spain’s case today, as one with –say– less than US$500 and no protection system, which was the case in the crisis in the early 1960s following Spain’s stabilisation plan. Significantly, 71% of respondents in a July 2012 survey by the Pew Research Centre said their standard of living was better than their parents at the same age (see Figure 16) and not much has changed since then.
Figure 16. Despite economic pessimism, people still feel better off than their parents (%) (1)
| % | |
| France | 48 |
| Germany | 70 |
| Italy | 57 |
| Spain | 71 |
| UK | 63 |
| Median of 21 countries surveyed | 59 |
Source: Pew Research Center, July 2012.
The decline in living standards can also be seen in the UN Human Development Index. Spain’s overall index value (the maximum is one), calculated on the basis of several categories, dropped from a high of 0.955 in 2007 to 0.885 in 2012 (see Figures 17 and 18), close to its level in 1980. The index value has steadily dropped since 2007, after rising continuously between 1980 and 2007. Per capita GDP was 97% of the EU average in 2012, down from a peak of 105 in 2007 and the biggest fall among the main euro-zone economies (see Figure 19)
Figure 17. UN Human Development Index (HDI) for selected countries
| Ranking (1) | Human Development Index value 2012 (2) | Life expectancy at birth 2012 (years) | Mean years of schooling (2010) | GNI per capita (2005 PPP US$) 2012 |
| 1. Norway | 0.955 | 81.3 | 12.6 | 48,688 |
| 3. US | 0.937 | 78.7 | 13.3 | 43,480 |
| 5. Germany | 0.920 | 80.6 | 12.2 | 35,431 |
| 20. France | 0.893 | 81.2 | 10.1 | 36,438 |
| 23. Spain | 0.885 | 81.6 | 10.4 | 25,947 |
| 25. Italy | 0.881 | 82.0 | 10.1 | 26,158 |
| 26. UK | 0.875 | 80.3 | 9.4 | 32,538 |
| 39. Poland | 0.821 | 76.3 | 10.0 | 17,776 |
(1) Out of 187 countries.
(2) The maximum value is one.
Source: United Nations Human Development Report, 2013.
Figure 18. Change in UN Human Development Index for selected countries, 1980-2012 (1)
| 1980 | 2007 | 2012 | Change 2007/12 | |
| Ireland | 0.840 | 0.965 | 0.916 | -0.049 |
| France | 0.876 | 0.963 | 0.893 | -0.070 |
| Spain | 0.855 | 0.955 | 0.885 | -0.070 |
| Italy | 0.857 | 0.951 | 0.881 | -0.070 |
| Germany | 0.869 | 0.947 | 0.920 | -0.027 |
| Greece | 0.844 | 0.942 | 0.860 | -0.126 |
| Portugal | 0.768 | 0.909 | 0.816 | -0.093 |
(1) The maximum value is one.
Source: UN Human Development Reports.
Figure 19. Per capita GDP in purchasing power standards (EU-27 = 100)
| 2007 | 2008 | 2009 | 2010 | 2011 | 2012 | |
| France | 108 | 107 | 109 | 108 | 109 | 108 |
| Germany | 122 | 124 | 123 | 128 | 125 | 125 |
| Greece* | 90 | 92 | 94 | 87 | 79 | 75 |
| Ireland | 145 | 131 | 128 | 127 | 129 | 129 |
| Italy | 104 | 104 | 104 | 101 | 100 | 98 |
| Portugal | 79 | 78 | 80 | 80 | 78 | 75 |
| Spain | 105 | 104 | 103 | 99 | 98 | 97 |
(1) Provisional.
Source: Eurostat.
Absolute poverty is affecting more people and income inequality is rising. However, the basic needs of the population are relatively well covered in Spain. The proportion of people deprived of basic needs is considerably lower for all age groups than the EU-27 average, according to Eurostat.[7] The poverty line in Spain is access to €600 a month, according to Caritas, which helped 1,015,276 people in need in 2011 (latest figure) compared with 300,000 in 2007. Children have been more affected than adults. According to UNICEF, Spain’s relative child poverty, a measure of inedquality, was almost 20% in 2012, only surpassed by Latvia, the US and Romania. This rate gives the proportion of a country’s children living in households where disposable income is less than 50% of the national median (after taking into account taxes and benefits and adjusting for family size and composition). The rate, however, reveals nothing about how far below each country’s relative poverty line those children are being allowed to fall. The best gauge of the depth of relative child poverty is the child poverty gap –the gap between the poverty line and the median income of those below the line–. Spain’s child poverty gap was the largest among the 29 countries surveyed by UNICEF at close to 40% of the poverty line.
The shadow economy (undeclared employment and the inadequate registration of income from sales or services), which has always been strong in Spain, even during periods of high growth (see Figure 20), and the extended family-based network have cushioned some of the effects of the crisis. Although the size of Spain’s shadow economy is almost the same as the EU average (18.4%), it greatly exceeds the figure for the other large European countries except Italy. Of note in Spain is the relatively high proportion of employment fraud within the shadow economy, which is estimated at around 8% of GDP or equivalent to hiding one million full-time jobs.[8]
Figure 20. The shadow economy in Europe, 2008-13 (% of official GDP)
| 2008 | 2009 | 2010 | 2011 | 2012 | 2013* | |
| France | 11.1 | 11.6 | 11.3 | 11.0 | 10.8 | 9.9 |
| Germany | 14.2 | 14.6 | 13.9 | 13.7 | 13.3 | 13.0 |
| Italy | 21.4 | 22.0 | 21.8 | 21.2 | 21.6 | 25.5 |
| Poland | 25.3 | 25.9 | 25.4 | 25.0 | 24.4 | 23.8 |
| Spain | 18.7 | 19.5 | 19.4 | 19.2 | 19.2 | 18.6 |
| UK | 10.1 | 10.9 | 10.7 | 10.5 | 10.1 | 9.7 |
| EU-27 | 19.3 | 19.8 | 19.5 | 19.2 | 18.9 | 18.4 |
Source: Eurostat, Professor Friedrich Schneider, Johannes Kepler University of Linz, Austria.
Measures taken to tackle the crisis and their impact
The Popular Party took office at the end of 2011 and was initially slow to get to grips with the crisis inherited from the Socialist government of José Luis Rodríguez Zapatero, but whose roots date back much further. The details of the 2012 budget, the most austere in almost 40 years, were not announced until after the regional elections in Andalusia in March of that year instead of in January. The PP had hoped to capture the Socialists’ fiefdom, which would have been a political milestone for the party and smoothed the path for austerity measures, but failed to do so. The Socialists, who have ruled Andalusia since 1978, were returned to power but only thanks to the support of the United Left.
The government’s overriding priority was to convince the markets that Spain should not be tarnished with the same brush as Greece, Ireland and Portugal, all of whom had been rescued by the EU. The key to this was to break the vicious circle between the banking sector and the sovereign, due to an important extent to the link brought about by banks holding government debt on their books. Breaking the negative feedback loop meant restructuring and recapitalising ailing banks and slashing the budget deficit. The crisis represented a long overdue opportunity for reforms that should have been carried out when the economy was booming.
(4.1) Public accounts: deficit moving in the right direction
The government faced a Herculean task on the budgetary front as it inherited a deficit of almost 9% of GDP in 2011 (well beyond the 6% target originally agreed with the EU by the previous Socialist government) and a commitment with Brussels to reduce it to the EU threshold of 3% in 2013.[9] As expected, the 3% target was far too ambitious a wrench for an economy in recession and the government was given in July 2012 another year to meet the threshold. This, too, proved to be unrealistic and after missing targets in 2012 (the deficit came in at almost 7% of GDP and 10.6% including the aid to ailing banks) and struggling with those for 2013, due to a combination of weaker-than-expected revenues, some expenditure overruns and higher social spending resulting from massive unemployment, Brussels came to Madrid’s rescue again in May 2013 and gave the government two extra years (until 2016) to meet the 3% reference. Consequently, the deficit target for 2013 was revised upward to 6.3% of GDP from the original objective of 4.5%.
Nevertheless, the government has made progress. The primary balance –government net borrowing or net lending excluding interest payments on consolidated government liabilities– has come down from a peak deficit of 9.4% of GDP in 2009 to a forecast 3.3% this year and less than half that in 2012, although still high (see Figure 21).
Figure 21. General government balance (% of GDP) (1)
| 2009 | 2010 | 2011 | 2012 | 2013 (f) | |
| Gen. govt. balance | -11.2 | -9.7 | -9.0 | -7.0 | -6.7 |
| Primary balance | -9.4 | -7.7 | -7.0 | -7.7 | -3.3 |
| Structural balance | -9.5 | -8.3 | -8.3 | -6.5 | -5.3 |
(1) Excluding financial sector support for 2011 and 2012.
(f) Forecast.
Source: Bank of Spain and IMF.
The cost of servicing the public debt has risen (the gross debt itself grew from 36.3% of GDP in 2007 to 92.2% in June 2013) and is higher than that of other core EU countries.10 The long average maturity of the debt, however, shields Spain from sudden rises in interest rates. The yield on Spain’s 10-year government bonds, which move inversely to prices, was below 4.20% in early October 2013, down from a peak of 7.75% in July 2012 and was lower than Italy for the first time in more than a year. Morgan Stanley advised investors in a 9 September report to buy 10-year Spanish government bonds and sell similar-dated Italian bonds.
Since the PP took office at the end of 2011 more than 374,000 jobs at the central, regional and local government levels have been shed and a freeze imposed on hiring new civil servants and on public sector wages. The bureaucracies of the regional governments became particularly bloated. While the number of people employed by the central government fell by 74% to 234,685 between 1982 and 2012, those employed by regional governments rose by a factor of 30 to 1,307,408 (see Figure 22). Redundant structures were created that overlapped with those of the central government, and the regions assumed the trappings of mini states, including a proliferation of official cars.
Figure 22. Growth in the number of civil servants, 1982-2102
| Type of administration | 1982 | 2012 | Difference |
| General government | 912,642 | 234,685 | -677,957 |
| Regional governments | 44,475 | 1,351,883 | 1,307,408 |
| Local governments | 167,045 | 597,212 | 430,167 |
| Total | 1,124,162 | 2,183,780 | 1,059,618 |
Source: Ministry of Finance and Public Administrations.
The main measures to lower the budget deficit since 2012 on the revenue side have been increasing VAT and personal income tax rates (corporation tax had not been changed since 2008, see Figure 23) and, on the spending side, reducing the number of civil servants and cuts in health and education expenditure and pension reform (see Figure 24).
Figure 23. VAT, personal and corporation tax rates, 2013
| Standard VAT rate | Top personal rate | Standard corp. rate | |
| France | 19.6 | 50.2 | 36.1 |
| Germany | 19.0 | 47.5 | 29.8 |
| Italy | 21.0 | 43.0 | 27.7 |
| Poland | 23.0 | 32.0 | 19.0 |
| UK | 20.0 | 45.0 | 23.0 |
| Spain | 21.0 | 52.0 | 30.0 |
| Sweden | 25.0 | 56.6 | 22.0 |
| EU-27 | 21.1 | 44.3 | 25.7 |
Source: Eurostat.
Figure 24. Main budgetary measures, 2013-15
| Revenue 2013 | Expenditure 2013 |
| Income tax and taxes on non-residents (0.3% of GDP) | Public employment (0.2% of GDP) |
| Environmental taxes (0.2% of GDP) | Employment policies (0.4% of GDP) |
| VAT (0.8% of GDP) | Long-term care (0.1% of GDP) |
| Excise duties (0.2% of GDP) | Regional measures, excluding public employment measures (0.6% of GDP) |
| Revenue measures at regional level (0.3% of GDP) | Local government reform and adjustment plans (0.2% of GDP) |
| Social contributions (0.2% of GDP) | Other, including reforms of regional government (0.4% of GDP) |
| Revenue 2014 | Expenditure 2014 |
| Corporate income tax (0.3% of GDP) | Public employment (0.2% of GDP) |
| Measures combating fraud (0.1% of GDP) | Long-term care (0.1% of GDP) |
| Revenue measures at regional level (0.2% of GDP) | Regional measures, excluding public employment measures (0.2% of GDP) |
| Local government reform and adjustment plans (0.3% of GDP) | |
| Other, including reforms of regional government (0.1% of GDP) | |
| Social security (0.1% of GDP) | |
| Revenue 2015 | Expenditure 2015 |
| Corporate income tax (-0.1% of GDP) | Public employment (0.1% of GDP) |
| VAT (0.1% of GDP) | Regional measures, excluding public employment measures (0.2% of GDP) |
| Revenue measures at regional level (0.2% of GDP) | Local government reform and adjustment plans (0.5% of GDP) |
| Other, including reforms of regional government (0.1% of GDP) | |
| Social security (0.1% of GDP) |
Note: The budgetary impact in the table is the impact reported in the government’s programme. A plus sign implies than revenue/expenditure increases/decreases as a consequence of this measure.
Source: Spanish government.
A budgetary stability organic law came into force in May 2012 in a bid to strengthen fiscal discipline across all levels of government. This introduced tighter rules, including a spending ceiling for regional and local governments, and corrective mechanisms and sanctions in the event of non-compliance with fiscal targets. Budget execution became more transparent as of May 2013 when the Ministry of Finance began to publish data for regions and social security on a monthly and national accounts basis. The law also provided for a suppliers’ payment scheme enabling regional governments to pay commercial arrears. An independent fiscal institution, along the lines of the UK’s Office for Budget Responsibility, to provide analysis, advice and monitor fiscal policy was also due to be set up, albeit more slowly than initially anticipated.
The 2014 budget continues the path of austerity. Public sector wages will be frozen for a fourth straight year and pensions will grow by just 0.25%. The still parlous state of finances is underscored by the setting aside of €36.6 billion to service the fast-rising pile of public debt, €2 billion more than will be spent on the 13 government ministries.
(4.2) Banking sector: strengthened, but bad loans continue to rise
The PP government hired in May 2012 the strategy consultants, Oliver Wyman[11] and Roland Berger,[12] to conduct a stress test of banks’ balance sheets and establish once and for all the solvency of banks. This top down exercise, which covered 90% of the banking system’s assets, was part of Spain’s fourth attempt in three years to clean up the sector and calm the market. The test identified 10 banks that were projected to face capital shortfalls. The overall shortfall in the most adverse (and unlikely) of the scenarios (which included a GDP shrinkage of 6.5% between 2012 and 2014) was between €57 billion (Berger) and a maximum of €62 billion (Wyman), or about 5.5% of GDP. The results unlocked a financing package of up to €100 billion agreed with the European Commission, the European Central Bank and the International Monetary Fund (known as the troika), of which only €41.3 billion (including for the bad bank Sareb) was required and disbursed, a large chunk of which went to recapitalise the nationalised bank Bankia via the state-owned Fund for Orderly Bank Restructuring (Frob). This bailout expires at the end of 2013.
A subsequent bottom up assessment showed that seven banks, including Santander, the euro zone’s biggest by market capitalisation, and BBVA, accounting together for 62% of the total loans analysed, did not need any more capital (Group 0), three savings banks and one commercial bank controlled by FROB accounted for 86% of the sector’s capital needs (Group 1) and the rest of banks were divided into groups depending on whether they required state aid (Group 2) or could obtain the capital funds by themselves (Group 3). FROB injected €37.0 billion of capital into Group 1 banks and €1.8 billion into Group 2 (see Figure 25).
Figure 25. Capital shortfalls and injection of public capital (€ million)
| Oliver Wyman capital shortfall | Injection of public capital | |
| Group 1 | ||
| BFA-Bankia | 24,743 | 17,959 |
| Catalunya Banc | 10,824 | 9,084 |
| Nova Caixa Galicia | 7,175 | 5,425 |
| Banco de Valencia | 3,462 | 4,500 |
| Group 2 | ||
| Banco Mare Nostrum | 2,208 | 730 |
| Liberbank | 1,197 | 124 |
| CEISS | 2,062 | 604 |
| Caja3 | 779 | 407 |
| Group 3 | ||
| Banco Popular | 3,223 | 0 |
| Ibercaja | 225 | 0 |
| Total | 55,898 | 38,833 |
(1) Figures are only estimates, as some operations, such as subordinated liability exercises (SLEs), are still ongoing and not yet final.
(2) State aid (injections of capital and CoCos by the FROB). For BFA-Bankia, €4,500 million was already contributed by the FROB in September, 2012.
(3) BMN: €63 million of lower tax liabilities. Banco Popular: €33 million of covered bonds buy-back, €125 million of net recoveries from previous write-offs, and €174 million of checked operating income. Ibercaja: €93 million of subordinated debt and securitisations repurchases.
(4) Does not include APS scheme covering up to 72.5% of loan losses on a €6,098 million loan portfolio, corresponding to an expected loss of about €600 million according to Bank of Spain estimates. As a result of the sales process of the bank, the final injection of capital has exceeded the initially estimated shortfall.
(5) Reduction in capital need from sale of assets: €770 million from the sale of the Caixa Penedés branch, and €81 million of securities sales. The capital increase by SLEs is estimated at €382 million, but the measures take into account only €182 million because €200 million had been taken into consideration in the stress test exercise, reducing the capital shortfall (a conversion of preference shares into CoCos was planned, but finally it was not carried out).
Source: Bank of Spain and FROB. Taken from the IMF’s third progress report, July 2013.
The eight banks receiving aid, under the terms of a Memorandum of Understanding (MoU), have to undergo a profound restructuring by 2017. Group 1 banks have to cut their balance sheets by 60% (and their branch networks) and focus on retail lending and to SMEs in their home regions, while Group 2 banks must reduce their balance sheets by between 25% and 40%.
In keeping with EU requirements, investors in the banks that received state aid, mainly small savers, took a heavy knock. The losses imposed on investors followed external valuations ordered by the FROB, which found that the liabilities of the nationalised banks far exceeded their assets. In Bankia’s case, it was given a negative value of €4.15 billion.
The nominal value of Bankia’s shares was reduced from €2 to €0.01 and the nominal value of its preferred shares and subordinated debt was reduced from €6.9 billion to €4.8 billion and this amount was then converted into ordinary shares. The FROB also reduced the value of preferred shares in Catalunya Banc’s by 61%, Banco Gallego’s by 50% and Nova Caixa Galicia’s by 43%
Among the banks which did not need any capital, Santander was the only financial institution, under the results of the adverse scenario, whose core Tier 1 capital ratio increased (from 9.7% to 10.8%) and with a capital surplus in 2014 of €25.3 billion. The Financial Stability Board includes Santander and BBVA in its list of the world’s 29 most systemically important banks (ie, those that are considered too big to fail, so they need to have more capital). Both are also included in the lowest risk category, with the minimum systemic capital buffer (100 bp above the BIS3 ratio, lower than the 250 bp requirement for many of their European and US peers).
Another condition set in the MoU was the creation of a ‘bad bank’ known as Sareb. Banks receiving state aid (Groups 1 and 2) were required to transfer all of their foreclosed assets and real estate development loans (over a minimum size) to Sareb. In exchange, these banks received government-guaranteed Sareb bonds that can be used as collateral for European Central Bank financing.
Sareb has around 200,000 real-estate-related assets from Group 1 (€36.5 billion) and Group 2 (€14.1 billion). On average, the transfer price was 47% of the gross book value. The initial capital of Sareb was €4.8 billion (€1.2 billion of equity and €3.6 billion of subordinated debt). The Frob owns 45% of the equity and 46% of the debt; 27 private investors own the rest. Sareb, established with €50.4 billion of real estate assets (see Figure 26), made its first sale of around 500 flats (valued at €100 million) to private equity group HIG Capital in August 2013.
Figure 26. Portfolio of assets transferred to Sareb (‘bad bank’), number and transfer value in € million
| Bank | Number | Transfer value (€ million) |
| Bankia | 89,814 | 22,153 |
| CX | 29,435 | 6,617 |
| CEISS | 18,115 | 3,140 |
| NCG | 17,887 | 5,064 |
| BMN | 16,138 | 5,817 |
| Liberbank | 14,120 | 2,917 |
| Banco Valencia | 6,723 | 1,923 |
| Caja3 | 3,976 | 2,212 |
| Banco Gallego | 1,276 | 606 |
| Total | 197,474 | 50,449 |
Source: Sareb.
The Bank of Spain, which was considered to be asleep on its watch when the crisis erupted, also had to reform the woefully inadequate supervisory system, adopt tougher measures regarding provisions, tighten the treatment of foreclosed property and land and of real estate collateral, and shorten the provisioning schedule for doubtful loans. Banks were required to set aside €84 billion of extra provisions to cover possible losses from real estate loans. This raised the average coverage of loans to the real estate sector from 18% at the end of 2011 to 45% at the end of 2012. Developments underway and land, both foreclosed and in doubtful situation, increased their coverage levels to 65% and 80%, respectively.
Banks have recognised as non-performing or substandard a whopping average 76% of their real estate exposure, based on the repossessed assets and stated NPLs (see Figure 27).
Figure 27. Accumulated real estate non-performing asset ratio (%) of main Spanish banks
| Ratio | |
| Santander | 85.0 |
| Sabadell | 79.9 |
| BBVA | 77.7 |
| Caixabank | 72.1 |
| Popular | 69.0 |
| Bankinter | 60.5 |
Source: Company reports. Morgan Stanley Research.
The sector’s overall health is beginning to improve though the non-performing loan ratio continues to rise (see Figure 28). Solvency and liquidity are better, and banks are also expected to benefit this year from a government move that would allow them to reclassify billions of euros in loans in deferred tax assets (DTAs) as tax credits. This would strengthen their balance sheets. Other euro zone countries such as Italy have already made similar changes. Spanish banks have around €50 billion in DTAs, which arise when they make losses or provisions that they can offset against future tax bills once they return to profitability. DTAs surged after the bursting of Spain’s property bubble that forced banks to set aside large provisions for property loans.
Figure 28. Selected financial soundness indicators, 2007-12 (% or otherwise indicated)
| 2007 | 2010 | 2012 | |
| Regulatory capital to risk weighted assets | 11.4 | 11.9 | 11.5 |
| Tier 1 capital to risk weighted assets | 7.9 | 9.7 | 9.9 |
| Return on average assets | 1.1 | 0.5 | -1.4 |
| Return on average equity | 19.5 | 7.2 | -21.5 |
| Non-performing loans (€ billion) | 16.3 | 107.2 | 167.5 |
| Non-performing loans to total loans | 0.9 | 5.8 | 10.4 |
| Exposure to construction sector (€ billion) | 457.0 | 430.3 | 300.4 |
| of which: non-performing | 0.6 | 13.5 | 28.2 |
| Households- home purchase (€ billion) | 595.9 | 632.4 | 605.3 |
| of which: non-performing | 2.3 | 5.4 | 7.5 |
| Loan-to-deposit ratio | 168.2 | 149.2 | 137.3 |
Source: Bank of Spain, European Central Bank, Bloomberg and IMF.
The incestuous nexus of cross-shareholdings between banks and big companies is also beginning to be ended, led by Bankia, as part of its bailout deal with Brussels. Bankia sold its stake in IAG, the parent company of Iberia and British Airways, and in Indra, the defence technology group, among other interests. Almost half of the 35 companies that comprise the Ibex stock market index are connected to one another through a significant shareholding. Bankia has also cut more than 800 of its 1,000 external directorships in a myriad of companies. Many of these people are politicians and trade unionists.
Banks and savings banks took stakes in companies such as Telefónica (telecoms), Repsol (oil) and Gas Natural when these companies were privatised more than two decades ago. Caixabank, for example, is the largest shareholder of Gas Natural and of Repsol which itself is the second largest shareholder in Gas Natural. Bankia is in the process of divesting its industrial portfolio.
The IMF’s third progress report on Spain’s financial sector reform, published in July 2013, said all the banks covered by the stress test exceeded minimum regulatory capital requirements (Core Tier 1 of 9%) at the end of March once the estimated effects of pending capital increase measures were included.
A collapse of a significant part of the banking system was averted, but credit conditions are still tight because of the impact of the crisis and Spain’s continued recession. Lending to the private sector has plummeted since 2008 and in 2013 was still lower in year-on-year terms than in 2012. The credit crunch is hitting small firms particularly hard (even profitable ones) and is holding back an economic recovery. The pace of credit contraction in Spain, according to the IMF, has been one of the fastest among advanced economies.
The authorities cannot afford to lower their guard. The Bank of Spain sent a letter to banks in June 2013 recommending that dividend distributions be limited and that cash dividends paid in 2013 not exceed 25% of attributable consolidated profit. Such action would help support capital ratios without a further acceleration of credit contraction, which would have a damaging impact on the economic growth that Spain so desperately needs in order to begin to create jobs.
The central bank is also developing forward-looking scenario exercises on bank resilience to help guide its supervisory decisions. This is important. ‘To ensure that banks maintain strong and transparent balance sheets, it will be essential to continue pro-active monitoring of financial sector health, with a view to identifying risks at an early stage and addressing them with prompt supervisory action when needed’, the IMF noted at the end of September after completing its fourth financial-sector monitoring mission.
The troika, which has the banking system under its tutelage, will decide by the end of the year whether Spain needs to extend the bailout as a safeguard for possible future capital needs. The government says it has sufficient funds and believes an extension would send a negative signal to the markets.
Bank results began to improve in the first half of 2013, largely as a result of setting aside a smaller proportion of income to cover bad loans. The net profit of Santander, the euro zone’s largest bank by market capitalisation, jumped 29% year-on-year to €2.26 billion and almost more than for the whole of 2012. Last year’s profits were heavily dragged down by provisions to cover bad loans to the Spanish property sector. Non-performing loans accounted for 5.18% of Santander’s overall loan book, half the average for the whole banking sector in Spain. BBVA, the second-largest Spanish bank, came close to doubling its profits in the first half. Net earnings rose 95% to €2.88 billion. The results of Santander and BBVA, whose combined assets in Spain account for around one-quarter of the country’s total banking assets, were helped by their units abroad, which offset poor results in its domestic market (see Figures 29 and 30). Emerging markets accounted for 56% of Santander’s profits and 58% of BBVA’s gross income. Bankia, the fourth-largest bank, posted a profit of €192 million in the first half after suffering Spain’s biggest-ever corporate loss in 2012 (€19.02 billion).
Figure 29. Distribution of Santander’s attributable profit (% of total) by operating segments, first half of 2013 (1)
| % of total | |
| Brazil | 25 |
| UK | 13 |
| Mexico | 12 |
| US | 12 |
| Spain | 8 |
| Rest of Latin America | 8 |
| Chile | 6 |
| Poland | 5 |
| Rest of Europe | 5 |
| Germany | 5 |
| Portugal | 1 |
(1) Excluding Spain’s run-off real estate.
Source: Santander.
Figure 30. Distribution of BBVA’s gross income by countries (% of total), first half of 2013
| % of total | |
| Spain | 29 |
| Mexico | 28 |
| South America | 23 |
| US | 10 |
| Turkey | 5 |
| Rest of Europe | 3 |
| Asia | 2 |
Note: BBVA does not provide a geographic profit distribution.
Source: BBVA.
(4.3) Labour market: more flexible, but still without net job creation
The Spanish economy contracted less than the Italian one between 2007 and 2013 (-5.6% as against -8.3%) and yet its official jobless rate more than trebled to 26% at the end of June, according to the quarterly labour force survey, while Italy’s doubled to 12%. Close to 60% of the almost 6 million unemployed had not worked for more than a year.
The chronic unemployment problem is as much related to Spain’s lopsided and unsustainable economic model, disproportionately based on the labour-intensive property and construction sectors, as to labour market regulations that are still too rigid.
This model created millions of jobs, mostly temporary ones, when the economy was booming and destroyed them equally massively when the housing bubble burst. Of the 3.7 million jobs shed since 2007, 1.6 million were in construction. Moreover, it acted as a magnet for millions of immigrants, without whom so many houses could not have been built. The unemployment rate of foreigners is 35%.
The Spanish labour market became highly segmented as of 1984 when a two-tier labour market reform created a large gap in employment protection legislation (EPL) between permanent and temporary workers. This was done by extending the use of temporary contracts with low dismissal costs to hire employees performing regular activities and not just seasonal/replacement ones. The proportion of workers on these contracts soared from around 12% before 1984 to 33% at the height of the economic boom (today around 23%).
Furthermore, the rigid collective bargaining system prevented firms from using flexibility measures, such as wage moderation or reduced hours, in order to adjust to downturns in the economy and save jobs. As a result of the two-tier system and the rigidities, more workers than otherwise might have been the case lost their jobs when the crisis came.
Both trade unions and to some extent the CEOE, the main employers’ association in which small and medium-sized firms are hardly represented, maintained the status quo. The unions’ main interest lay with looking after permanent workers (key in the elections for workers’ representatives), while, in the words of Professor Juan J. Dolado, a labour market expert at the Carlos III University, ‘typically large firms can afford higher wages due to their greater market power and therefore use collective bargaining as a barrier to prevent free entry into those industries where they have a dominant position’.[13]
Spain’s trade unions, largely concentrated in the public sector and on those workers with permanent jobs, wield an influence out of proportion to the low affiliation, which remained unchanged at 16% between 2001 and 2011 (see Figure 31).
Figure 31. Trade union membership, 2001 and 2011, in OECD countries
| 2001 | 2011 (1) | |
| Iceland | 88.1 | 79.4 |
| Sweden | 77.3 | 67.7 |
| Italy | 34.2 | 35.1 |
| UK | 29.6 | 25.8 |
| Germany | 23.7 | 18.5 |
| OECD | 19.9 | 17.5 |
| Spain | 15.9 | 15.9 |
| France | 7.9 | 7.6 |
(1) 2011 or latest year available.
Source: OECD, Trade Union Density 2011.
In February 2012, soon after taking office, the PP government introduced the eighth and most ambitious package of labour market reforms since 1984, through a decree-law as trade unions and employers failed to reach an agreement. The reforms cut the maximum severance pay that employees can receive to 33 days salary per year of service, down from 45 days, with a cap of 24 months’ pay. In 2012, Spain’s average redundancy costs in weeks of salary were 17.4, lower than Germany but double that of the UK (see Figure 32).
Figure 32. Redundancy costs (in weeks of salary), selected countries, 2012
| Number of weeks of salary | |
| Denmark | 0 |
| US | 0 |
| Italy | 7.2 |
| UK | 8.4 |
| France | 11.8 |
| Spain | 17.4 |
| Germany | 21.6 |
Source: World Bank/International Finance Corporation, Doing Business 2013.
Companies in hardship can opt out of industry-wide collective bargaining agreements reached with unions, and have greater flexibility to adjust working conditions such as schedules, workplace tasks and wages depending on how the economy and the company are doing. Wage growth has moderated. Co-operation in labour-employer relations has improved over the last year, as shown in the World Economic Forum’s latest Global Competitiveness Index where Spain moved up 10 places in the ranking of this factor (see Figure 33).
Figure 33. Co-operation in labour-employer relations (1)
| Rank (2) and country | Score |
| 1. Switzerland | 6.0 |
| 18. Germany | 5.2 |
| 26. UK | 5.0 |
| 42. US | 4.7 |
| 107. Spain | 4.0 |
| 135. France | 3.4 |
| 136. Italy | 3.4 |
(1) 1 = generally confrontational; 7 = generally co-operative.
(2) Out of 148 countries.
Source: Global Competitiveness Report 2013-2014, World Economic Forum, executive opinion survey.
Time limits have been set for the legal proceedings associated with firings to avoid drawn-out cases that caused companies to settle for the upper limit on dismissal pay rather than pay court costs, a new permanent contract created for SMEs with a one-year trial period, aimed at young people, and prior authorisation eliminated for collective dismissals. According to Gayle Allard, a professor at the IESE business school in Madrid, the rigidity of Spain’s labour markets, using the OECD’s quantitative indicator for EPL, dropped by more than 25% as a result of the reforms.
The reforms, however, have still not properly addressed the issue of a dual labour market, which could have been achieved by introducing a single open-ended contract. Even after substantial falls, the share of workers with temporary contracts –at more than 22% of the total– is still the highest in the euro zone. Training programmes for the unemployed are also hardly changed, but the monopoly enjoyed by unions and employers as beneficiaries of subsidies for training programmes –which produced fraudulent practices– has been ended. Another unresolved problem is the ‘judicialisation’ of labour relations; the courts are usually biased against employers. There is still uncertainty around the judicial interpretation of the criteria for ‘objective dismissals’.
The reforms are not yet having any significant impact on job creation other than on part-time employment. The number of part-time jobs reached a record 2.75 million at the end of June 2013 (16.4% of the working population) and 15.5% higher than in 2007. This is an important change: many part-timers go from being subsidy receivers to tax payers, which improves government accounts both ways. Part-time jobs offer a welcome degree of flexibility and help people between changing jobs or professions. Part-time jobs as a proportion of total employment, however, is still low in Spain (see Figure 34).
Figure 34 Part-time jobs, 2012 (% of total employment)
| % of total employment | |
| Netherlands | 49.8 |
| UK | 27.2 |
| Germany | 26.7 |
| EU-27 | 20.0 |
| France | 18.0 |
| Italy | 17.1 |
| Spain | 14.7 |
Source: Eurostat.
Twenty years ago the distinguished sociology professor, Víctor Pérez-Díaz, called the employment situation ‘the society of four squares’ after a children’s game, and little has changed since then. People, particularly the young, move between four points: a fixed-term, precarious job; the shadow economy; unemployment benefits and, if they are lucky (increasingly less today), permanent employment.
The labour market changes could lower the GDP growth threshold for net job creation from around 2% to 1.3% once the economy starts to grow again. But Spain is not expected to expand by more than 1% until 2018, according to the IMF’s latest and pessimistic forecasts, although the government is more optimistic about growth prospects.
A new economic model based more on knowledge and less on bricks and mortar has yet to emerge. Given the state of the education system and the large pool of unskilled workers, it will be very difficult to achieve this (see the section below).
With the construction and property sectors unlikely to get back on their feet for a decade, massive job cuts in the public administrations in order to cut the budget deficit (many jobs in regional governments are superfluous) and depressed domestic consumption discouraging the creation of new firms, the employment outlook is bleak. The one bright spot is exports, but this sector cannot create sufficient jobs to make a major dent in unemployment, and nor can tourism.
The IMF proposed a pact in August 2013 between trade unions, employers and the government under which workers would accept further wage moderation in return for job creation and the government would reduce social security costs. All sides rejected it for a variety of reasons. According to an IMF simulation, based on a 10% wage cut, such a pact could result in the unemployment rate falling by six to seven percentage points. Oli Rehn, the European Commissioner for Economic and Monetary Affairs, called for the idea to be given a try, but it fell on deaf ears.
(4.4) Housing market: tough adjustment and oversupply
Five years after the bursting of Spain’s property bubble, there was still a glut of homes and, consequently, house prices continued to fall. The stock14 of unsold new homes has not changed significantly since 2009 (see Figure 35), while prices have declined on average by more than 30% since the first quarter of 2008 (see Figure 36).
Figure 35. Stock of unsold new homes, 2004-13
| 2004 | 102,825 |
| 2005 | 195,184 |
| 2006 | 273,363 |
| 2007 | 413,642 |
| 2008 | 613,512 |
| 2009 | 688,044 |
| 2010 | 687,523 |
| 2011 | 676,038 |
| 2012 (e) | 650,000 |
| 2013 (e) | 650,000 |
Source: Public Works Ministry (Ministerio de Fomento) and Afi estimates.
Figure 36. House-price Indicators, selected European countries
| % change since first quarter of 2008 (1) | |
| Germany | +20.5 |
| France | +0.7 |
| Italy | -10.9 |
| Spain | -30.3 |
| Ireland | -49.0 |
(1) Latest available.
Sources: The Economist and others. See www.Economist.com/houseprices.
The market has undergone a tough adjustment and has not yet bottomed out (see Figure 37). Prices are not expected to begin to rise again until 2015 and then only minimally. As well as the continued over supply, demand has plummeted. According to the labour force survey, the number of households dropped by 80,200 between October 2012 and March 2013. Young adults are leaving home later and the number of divorces has fallen, among other factors. This was the sharpest fall in households since the statistical series began.
Figure 37. The market adjustment
| Peak situation | Current situation |
| Annual promotion: 886,000 new homes (1) | Annual promotion: 40,000 new homes |
| Annual demand: 326,000 new homes and 449,000 used homes (2) | Annual demand: 161,000 new homes and 168,000 used homes |
| Home mortgages: 1.35 million mortgages a year, €173 billion in loans (3) | Home mortgages: 256,000 mortgages a year, €26 billion in loans |
| Prices: €2,101 a square metre. A nominal rise of 200% during the expansive cycle and 30% nominal growth during the bubble period (+17.2% real) (4) | Prices: €1,519 a square metre. Nominal reduction of 27.7% (34.3% real) (5) |
(1) Houses approved, maximum in April 2007.
(2) Transactions (INE), maximum in December 2007.
(3) Includes purposes other than the buying of a home.
(4) Upward cycle, 1998-2004; bubble, 2005-2008.
(5) According to the INE price index, the nominal reduction since the third quarter of 2007 was 36.2% and the real 43.4%.
Source: Bankia report, June 2013.
Foreign investment-fund managers are beginning to descend on Spain in droves in search of real-estate bargains. A company belonging to the Madrid Town Hall sold 1,860 social housing flats to the US fund Blackstone in July for €128.5 million and another belonging to the Madrid regional government sold 2,935 flats for €201 million to Goldman Sachs private equity and Azora, an investment company. These flats are part of a scheme known as the ‘Young Plan’ to provide housing to people under 35 with below-average income, who later can have the right to buy the flats.
Pending issues
(5.1) Taxation: an inefficient system
A major structural problem yet to be resolved is how Spain will bridge its traditional gap between public spending and tax receipts. Expenditure averages around 40% of GDP over the length of a cycle and tax receipts about 35% of GDP, leaving a shortfall (budget deficit) of 5% that has to be financed. This requires action on both fronts.
Spaniards, however, have a schizophrenic attitude to raising taxes: they want a Swedish-style welfare state but with Chilean tax rates.
The windfall revenue from the property boom of 5%-6% of GDP was used by regional governments to create a spending structure, particularly in bloated bureaucracies, that could not be sustained unless the boom lasted forever, which was clearly never going to happen. It was no coincidence that Catalonia, Valencia, Andalusia, Murcia and the Balearic Islands, the regions along the Mediterranean most heavily dependent on the property boom, had the highest budget deficits after the property bubble burst.
The sensible thing to have done during the boom years would have been to take a leaf out of the books of the Norwegian and Chilean governments who used the windfalls from their respective oil and copper wealth to establish rainy day funds.
This did not happen and, furthermore, the shift since the bursting of the property bubble in the composition of economic activity towards exports has come with a tax cost as property is more tax intensive than exports. As a result, tax reform, as well as permanent spending cuts, is urgently needed. A team of tax experts is studying the issue and will report to the government by February 2014. Serious reform involves confronting vested interests –from big companies whose effective tax rates are very low to road-haulage operators who benefit from preferential tax treatment for diesel compared to petrol–.
Spain has a low tax-to-GDP ratio (33% in 2012 including social security contributions) compared with the EU-27 average and the national average over the last decade (see Figure 8). Both direct and indirect taxes have lower shares as a percentage of GDP (2012 direct taxes: 10.1% of GDP; EU-27: 13%; indirect taxes 10.2% and 13.3%, respectively). The UK, for example, has lower personal income tax rates than Spain and yet its receipts as a percentage of GDP are significantly higher than Spain’s (see Figure 38).
Figure 38. Personal income tax receipts (% of GDP), 2012
| % of GDP | |
| Denmark | 30.2 |
| Finland | 16.0 |
| Italy | 15.1 |
| UK | 14.9 |
| EU-27 | 13.0 |
| Germany | 12.1 |
| France | 12.0 |
| Spain | 10.1 |
Source: Eurostat.
The government broadened the very narrow VAT base in 2012 by reducing the scope of application of the super-reduced and reduced tax rates. The standard (from 18% to 21%) and the reduced rate (from 8% to 10%) were increased, while the 4% super-reduced rate has remained unchanged. But there is still a significant number of goods and services subject to the reduced and super-reduced rates (eg, food and health products, and some tourist services). Furthermore, revenues from environmental taxes as a percentage of GDP are the lowest in the EU at around 1.5%, compared to more than 4% in some countries.
Small and medium-sized firms (SMEs) under a certain turnover threshold have a reduced corporate income tax rate of 25% (the standard rate is 30%), yet they pay on average a higher effective rate than much larger companies because of very generous deductions against tax for depreciation, goodwill and R&D spending. And despite the deductions for R&D, Spain’s expenditure on this item (1.3% of GDP) is one of the lowest among developed countries, which suggests the deductions have no impact whatsoever on fostering a more knowledge-based economy. The effective tax rate of the 35 companies (the country’s largest) in the Ibex index, the benchmark of the Madrid Stock Exchange, is a derisory 11%.
According to the think-tank Fedea, loopholes allowed companies to avoid €2.6 billion in potential tax payments in 2012, while income-tax incentives were worth €10.3 billion. Company tax rates are higher than in most developed nations at 30%, but intake is 1.9% of GDP compared with the EU average of 2.7%, and brings in just 10% of revenue.
The structure of the tax system is not only inefficient but not very growth or job creation-friendly. Social Security contributions as a percentage of GDP are the highest in the EU after France.
In property taxation, the government withdrew in 2012 tax compensation in personal income tax for house purchases made before 2006 and removed home mortgage deductions against personal income tax as of 2013. These incentives ‘capitalised’ into higher house prices, and ultimately raised land prices, encouraging property speculation.
Measures were introduced in 2012 to combat tax evasion, which remains high. They include heavier penalties, limits on cash payments, new reporting obligations for assets held abroad and application of the VAT reverse-charge mechanism for some high-risk sectors.
(5.2) Pensions: under strain
Spain’s pay-as-you-go pension system in its current state is unsustainable, due to a combination of demographic factors, high unemployment –which has reduced the number of social security contributors per retiree and weakened the financial health of the social security– and pension rises in pre-crisis years that cannot be sustained.
The number of social-security contributors dropped from 19.4 million in 2008 to 16.3 million in September 2013, while the number of contributory pensioners rose from 8.4 million to 9 million over the same period. This lowered the number of these contributors per pensioner from 2.3 to 1.8. The average Spaniard today lives 81.6 years compared with 72.8 in 1970, the third-longest in the EU after Italy and France, and when he or particularly she reaches 65 that person lives close to 21 years more. With a low birth rate (1.3) and increasing life expectancy, government figures suggest 32% of Spain’s population will be aged 64 or over by 2050 (17.4% in 2012). The number of pensioners is expected to rise from nine million to 12 million over the next three decades.
The PP government raised the early retirement age by two years to 65 in 2012, which combined with the gradual increase in the statutory retirement age to 67 (in 2011 by the previous Socialist government and fully effective as of 2027), could push the effective retirement age to 66 years. Pensions will also be calculated on the basis of the last 25 years’ of a worker’s earnings, instead of the current 15 years. The reforms particularly affect young people: the youth unemployment rate (those aged between 16 and 24) is officially more than 50% and many are approaching the age of 30 without having yet obtained regular work.
The reforms were insufficient, and in April 2013 the government set up an independent committee of 12 experts that proposed in June measures to ensure the pension system’s solvency and sustainability based on a ‘sustainability factor’ (an annual formula for updating pensions). Parliament was expected to approve the reforms by the end of the year, though it could face stiff resistance from trade unions. The reform that grabbed the headlines was that rises in pension payments as of 2014 will no longer be automatically indexed to annual inflation.
The ‘sustainability factor’ has two components: an intergenerational equity factor and an annual growth factor.[15] The first factor updates pension benefits for life expectancy –for a given base contribution history, an increase in the retirement period means a decline in the monthly pension benefit–. The other determines the annual increase in pension benefits (see Figure 39). As the system becomes wealthier, so benefits grow.
Figure 39. Sustainability factor formula for annual pension benefit growth
| Annual benefit growth | = | Average inflation | + | Growth of revenues in real terms | – | Growth in the number of pensions | – | Difference of new less expiring pensions | + | Convergence speed | x | Structural surplus or deficit of system |
Source: Pension Experts Committee.
Pension payments are slated to rise by a minimum of 0.25% as of next year, well below expected inflation rates, and the maximum increase, when the system can afford it, will be capped at inflation plus a 0.25 pp top up. The savings, estimated at €800 million in 2014 and €33 billion over the next decade, will help to reduce the structural budget deficit.
(5.3) Education: holding back a more knowledge-based economy
Spain’s education system is in crisis and hindering the country moving towards a more knowledge-based economy and realising its full potential.
One in every four people between the ages of 18 and 24 are early school leavers, double the EU average but down from a peak of close to one-third during the economic boom, when students dropped out of school at 16 (the age at which compulsory schooling ends) and flocked in droves to work in the construction and real-estate sectors (see Figure 40).16 This improvement, the OECD noted in its 2013 Education at a Glance report, suggests that some young Spaniards see education as a temporary way out of unemployment and a potential advantage when they try to get back into employment at a later stage. This is an encouraging sign.
Figure 40. Early school leaving rates in the EU and national 2020 target (1)
| 2010 | 2011 | 2012 | Target | |
| Finland | 10.3 | 9.8 | 8.9 | 8.0 |
| France | 12.6 | 12.0 | 11.6 | 9.5 |
| Germany | 11.9 | 11.7 | 10.5 | Less than 10.0 |
| Italy | 18.8 | 18.2 | 17.6 | 15.0-16.0 |
| Poland | 5.4 | 5.6 | 5.7 | 4.5 |
| Spain | 28.4 | 26.5 | 24.9 | 15.0 |
| UK | 14.9 | 15.0 | 13.5 | No target |
| EU | 14.0 | 13.5 | 12.8 | Less than 10.0 |
(1) Those aged between 18 and 24who have only lower secondary education or less and are no longer in education or training.
Source: Eurostat.
Equally worrying is that close to one-quarter of 15-29 year-olds are not in education, training or employment (see Figure 41). Furthermore, results in the OECD’s Pisa tests in reading, mathematics and scientific knowledge for 15-year-old students and for fourth-grade children in the TIMS and PIRLS tests are poor, there are only three Spanish universities among the world’s top 200 in the main academic rankings (and towards the bottom) compared with two each for the much smaller Chile, Finland and Ireland (see Figure 42) and gross R&D spending, at 1.3% of GDP, is still way below that of other developed economies, although the figure has doubled in the last 15 years (see Figure 43). In 2011 (latest year), Spain had 32.6 patent applications per million inhabitants made to the European Patent Office compared with 298.4 from Sweden, 290.7 from Germany and 132.4 from France.
Figure 41. Percentage of 15-29 year olds not in employment, education or training (1)
| % | |
| Finland | 11.8 |
| France | 16.4 |
| Germany | 11.0 |
| Italy | 23.2 |
| Spain | 24.4 |
| UK | 15.5 |
| OECD average | 15.8 |
(1) 2011.
Source: Education at a Glance 2013, OECD.
Figure 42. The top 200 universities in the world by country
| Country | Number of universities in the ranking |
| US | 51 |
| UK | 29 |
| Germany | 13 |
| Netherlands | 11 |
| Canada and Japan | 9 |
| China and Australia | 8 |
| Switzerland | 7 |
| Belgium | 6 |
| Israel and Sweden | 4 |
| Spain | 3 |
| France | 5 |
| Chile, Finland, Italy and Ireland | 2 |
Source: QS, 2013 ranking.
Figure 43. Gross expenditure on R&D (% of GDP) (1)
| % of GDP | |
| Finland | 3.78 |
| France | 2.24 |
| Germany | 2.84 |
| Hungary | 1.21 |
| Italy | 1.25 |
| Spain | 1.33 |
| Sweden | 3.37 |
| EU-27 | 2.03 |
(1) 2011.
Source: Eurostat.
However, the three leading Spanish graduate business schools are among the best internationally. According to the 2013 Financial Times rankings, IESE ranked 7th, IE ranked 11th and ESADE ranked 22nd in the world, a remarkable feat for a country like Spain, which has the second-largest number of such schools in the top 25 after the US. This success is in stark contrast to that of Spanish universities. The universities are mostly state-owned and run like the civil service. They do not compete internationally or with each other. A very large proportion of students never complete graduation or take many years do so, as exams can be repeated up to seven times. Since the universities are heavily subsidised, huge amounts of government money are wasted. Faculties are almost totally endogamic and the appointment and promotion system is widely perceived to be corrupt.
In primary and secondary education, the main problems are in the education philosophy and teaching methods. The system is not designed to achieve a certain level of competencies and skills but to make students learn by rote. Also, the grading system concentrates on what the student do not know, resulting in disappointment, apathy and a lot of students quitting school as soon as they can.
The system of vocational training arranged at the end of the 1980s has worked reasonably well, but does not provide enough programmes, particularly for industry. The government is trying to strengthen the role of companies, in line with the German dual system, but is unlikely to make any progress in this area given the scant training culture of SMEs and the high costs they would have to support.
The country, nevertheless, has achieved a lot in the educational field in the last 40 years, particularly when it is borne in mind that it was not obligatory to attend school (between the ages of six and 14) until 1970, much later than most other developed countries. Since the 1980s there has been uncontrolled growth in the number of universities and education centres, at the cost of quality.17 Spain’s tertiary education attainment level is higher than Germany’s and almost double that of Italy’s (see Figure 44). Yet more so than in most other developed economies, it is not uncommon today to find graduates in jobs that demand little or no qualifications. Furthermore, it is common for these people to hide their qualifications in order not to appear over-qualified for the job. At one end of the education spectrum, there are jobholders who are over-qualified for the work they do –something that is related to the economic model– and at the other end there is a large pool of poorly qualified people who left school early and today are unemployed.
Figure 44. Tertiary education attainment or equivalent among those aged 30-34 (%), and national 2020 target
| 2010 | 2011 | 2012 | Target | |
| Finland | 45.7 | 46.0 | 45.8 | 42.0 |
| France | 43.5 | 43.3 | 43.6 | 50.0 |
| Germany | 29.8 | 30.7 | 31.9 | 42.0 |
| Italy | 19.8 | 20.3 | 21.7 | 26.0-27.0 |
| Poland | 35.3 | 36.9 | 39.1 | 45.0 |
| Spain | 40.6 | 40.6 | 40.1 | 44.0 |
| UK | 43.0 | 45.8 | 47.1 | No target |
| EU | 35.5 | 34.6 | 35.8 | At least 40.0 |
Source: Eurostat.
The crisis in education, which began well before the country’s recession as of 2009 and the subsequent budget cuts, is not a question of money. According to the OECD’s 2013 Education at a Glance, expenditure per student (primary to tertiary education) in 2010 (latest year for comparative figures) was above the OECD average (US$9,500 and US$9,300, respectively). The level of expenditure is affected, among other factors, by the size of a country’s school-age population and its enrolment rates. Spain’s total spending (public and private) on education institutions as a percentage of GDP was lower, however, than the OECD average (5.6% and 6.3%, respectively, in 2010). The relatively low overall spending and relatively high expenditure per student is partly explained by the fact that Spain has a smaller proportion of 5-19 year-olds than those in other OECD countries.
As a percentage of GDP, Spain’s public spending on education was 5% of GDP in 2010, below the OECD average (see Figure 45). Annual public expenditure per student on public primary, secondary and post-secondary non-tertiary education institutions was US$9,600, above the OECD average of US$8,400. At the tertiary level, public expenditure per student was also higher than the average at US$12,000.
Figure 45. Total public expenditure on education (% of GDP), 1995 and 2010 (1)
| 1995 | 2010 | |
| Finland | 6.8 | 6.8 |
| France | 6.3 | 5.9 |
| Germany | 4.7 | 5.1 (2) |
| Italy | 4.7 | 4.5 |
| Poland | 5.2 | 5.2 |
| Spain | 4.6 | 5.0 |
| UK | 5.0 | 6.3 |
| OECD average | 5.4 | 5.8 |
(1) Including public subsidies to households for living costs (scholarships and grants to students/households and students loans), which are not spent on educational institutions.
(2) 2009.
Source: 2013 Education at a Glance, OECD.
One institution that has been hard hit by budget cuts is Spain’s National Council for Scientific Research (CSIC), the country’s largest scientific organisation, which generates 20% of the country’s scientific output. Its funding by the government has been cut by more than €500 million since 2010. After more than doubling its investment in science between the late 1990s and 2009, the state has taken an axe to the science budget. In 2011 the PP eliminated the Science Ministry. Spain has reportedly only partially paid its membership dues to research organisations such as the European Science Foundation and the European Space Agency.
The government approved in June a draft law to improve the quality of education, which, together with deep cuts in education budgets, provoked protests by teachers, parents and students. The proposals, expected to be approved by the end of the year, include:
- Under the banner ‘Lifelong learning’, the reform proposes to allow an earlier choice (at age 14) of subject specialisation, encouraging greater take-up of technical courses or higher education.
- More independence to schools and colleges to choose the subjects they offer, detaching them to an extent from regional authorities (education is a regional competence in Spain) and linking the funding they receive to the quality of the programmes. As a counterbalance, the Ministry of Education will have more control over the curricula than before.
- Possibility of access to basic two year technical training between the ages of 14-17.
- Ease the access for graduates of technical schools/streams to higher education.
- Personalised learning supported through ICT.
- Increase the number of official evaluations at each educational stage (at the ages of 11, 14 and the last one at 17-18). The evaluations will be designed by the Ministry.
- Directors of education centres to be appointed on merit, based on criteria fixed by the Ministry.
- Students would be unable to pass their course with more than three failed subjects.
- Universities will set their own access criteria, which can be agreed with the schools. The national access to university test will be abolished.
- Government scholarships for the children of low income families will be conditional on good marks.
The criticism, generally from the left, covers the following areas:
- The measure intended to guarantee that the main subjects are taught through the Spanish language is perceived as discriminating against regional languages (Catalan, Galician and Basque). At parental request, regional governments could be obliged to pay for private school if necessary to ensure that the wish of the parents that their child be taught in Spanish was met.
- Religion will be back on the curriculum replacing ‘Citizenship and civic education’, although an alternative non-religious subject is also offered. The influence of the church has been strongly criticised as not respecting the church-state divide.
- The reform will allow ‘single sex schools’ to receive public funding contradicting rulings by the Supreme Court.
- A particularly controversial point is the increase in evaluations in education at each stage, which is seen as a way of limiting access to higher education from an early age, and as generating an increased risk of early dropout if children are not mature enough to decide about their future careers.
- Increase in the number of students per class, worsening individualised attention and quality of teaching.
Spain needs to learn from top performing countries’ philosophies and education systems, and until it does so the system will not improve. Moreover, it will take at least a decade before the fruits of reforms are seen and that assumes a start is made in the right direction.
(5.4) Justice: a very long way to go
Spain’s justice system is notoriously slow and excessively politicised.[18] Its functioning has deteriorated over the past four decades. The public has a low degree of confidence in the system, as evidenced by the consistently low ranking of justice institutions in Metroscopia’s evaluation of institutions and social groups. The problem is not one of under-funding. Per capita public spending on the system was 50% higher than France in 2010 (latest comparative figures) and only 10% lower than in Germany, and the number of courts for every 100,000 citizens is also much higher in Spain than in France (see Figure 46).
Figure 46. Justice system indicators (1)
| Spain | France | Germany | |
| Public spending on justice per capita (€) (2) | 91 | 60 | 100 |
| Courts per 100,000 inhabitants | 1.6 | 1.0 | 1.8 |
| Judges per 100,000 inhabitants | 10.2 | 10.7 | 24.3 (3) |
| Other personnel per 100,000 inhabitants | 87 (4) | 32 | 66 |
| New civil and commercial cases per 100,000 inhabitants (first instance) | 4,000 | 3,000 | 2,000 |
(1) 2010.
(2) All courts, office of the public prosecutor and judicial aid.
(3) It could include justices of the peace.
(4) Calculation by César Molinas.
Source: European Commission for the Efficient of Justice, European Judicial Systems 4th Report (2012), and Qué hacer con España by César Molinas.
Yet in 2013 there were more than 3 million unhandled complaints. Spain is a particularly litigious society (double that of Germany on the basis of court cases per 100,000 inhabitants), largely due to the huge number of legal provisions (more than 100,000, 60,000 of which correspond to regional and local administrations) open to multiple interpretations because of their opacity and poor technical quality. Madrid is said to be the city with the most lawyers in the world after New York.
Other problems are the very low degree of computerisation in the administration of justice, which remains as awash with paper as it was in the 19th century, and the lack of connection between the justice systems of the 17 regions (the central government devolved the administration of justice to them). The regional administrations do not have common IT programmes or operating systems and each goes its own way.
The handling of corruption cases involving politicians and their business associates –more than 800 since 2008– is particularly sluggish if handled at all. ‘Spain is suffering from a politicisation of justice and a judicialisation of politics’, said Antonio Garrigues, the chairman of Garrigues, the largest law firm.[19] The 20 members of the Consejo General de Poder Judicial (CGPJ), the governing body of the judiciary and a nest of political interests, are elected by parliament and the senate (10 each). A lot of horse-trading goes on: those proposed need a three-fifths majority. This body, in turn, proposes the members of the Supreme Court. Eight of the 12 members of the Constitutional Court are also appointed by parliament and the senate, two by the government and two by the president of the CGPJ. The political affiliation of the members of these three bodies are also clearly identified by whether they belong to the ‘progressive’ or ‘conservative’ professional associations. The Constitutional Court was renewed in June 2013 and, as expected, moved rightward as the conservative Popular Party is in power.
The political class shows no signs of wanting to resolve these problems. The proposed reform of passing the investigation of all crimes from judges (jueces) to public prosecutors (fiscales) would bring Spain’s criminal procedure law into line with the EU norm (it dates from 1882), but, in the case of politicians under investigation, would deepen the suspicion that impunity might be easier as the director of public prosecutions is a political appointment.
Exports: the need to sustain their momentum
Spain is not a major exporting country and yet between 2009 and 2012 exports of goods rose by €63 billion to a record €222.6 billion, an improvement equivalent to more than 5% of GDP and a faster pace of growth than Germany, France and Italy, albeit from a smaller base, and they continued to rise in 2013.
Given the weakness of most markets in the EU, Spain’s principal export destination, the export performance is remarkable and shows what companies can do in order to survive when the chips are down by becoming more competitive. As a euro country, Spain cannot devalue, as it did in the past in order to boost competitiveness, and has to rely on ‘internal devaluation’. But for the export success, Spain’s recession would have been deeper or what little growth there has been even weaker (see Figure 47).
Figure 47. Contribution of domestic and external demand to GDP growth (annual % change)
| 2009 | 2010 | 2011 | 2012 | 2013 (e) | |
| Domestic demand | -6.4 | -0.6 | -1.9 | -3.9 | -3.7 |
| Net exports | +2.7 | +0.3 | +2.3 | +2.5 | +2.1 |
| GDP growth | -3.7 | -0.3 | +0.4 | -1.4 | -1.6 |
Source: INE and IMF.
The number of companies now regularly exporting is around 100,000 out of a total of up to 200,000 compared with 40,000 regular exporters before the onset of the crisis in 2008. While the US, the UK, Germany, France and Italy have lost global market share to varying degrees over the last decade, mainly to China and other emerging countries, Spain’s share of world merchandise exports has remained virtually unchanged at around 1.6% (see Figure 48), according to the World Trade Organisation (WTO).
Figure 48. Global market share of merchandise exports, 2000-12 (%)
| Country | 2000 | 2009 | 2010 | 2012 |
| China | 3.9 | 9.6 | 10.4 | 11.2 |
| US | 12.3 | 8.5 | 8.4 | 8.4 |
| Germany | 8.7 | 9.0 | 8.3 | 7.7 |
| France | 4.7 | 3.9 | 3.4 | 3.1 |
| Italy | 3.71 | 3.2 | 2.9 | 2.7 |
| UK | 4.5 | 2.8 | 2.7 | 2.6 |
| Spain | 1.8 | 1.7 | 1.6 | 1.6 |
Source: World Trade Organisation.
The continued boom in merchandise exports and in tourism (a record 42.3 million visitors in the first eight months) helped Spain generate a current account surplus of €1.35 billion in the first half compared to a deficit of €16.97 billion in the same period of 2012, according to the Bank of Spain. In 2014, according to OECD forecasts, the surplus will be 3.5% of GDP, one of the 10 largest among developed countries, compared to a deficit of close to 10% in 2008. This is an impressive turnaround and is not just due to prolonged import weakness.
The trade deficit was €2.71 billion, down from €15.64 billion in the first six months of 2012. This was due to 9.4% growth in exports and a 1.7% fall in imports. The imported energy bill remains high. According to the IMF, exports accounted for about 5.5% of GDP improvement in the trade balance between 2008 and 2012 and the other 1.1% from import compression.
The overall balance of payments (current and capital accounts) –a country’s financing capacity or need– was €5.24 billion positive as against €14.58 billion negative in the first six months of 2012. This was the first half-year surplus since 1997.
Food exports surpassed those of vehicles, traditionally a major item, and sales outside of the slow-growing euro zone, the main destination, rose further, particularly to the Middle East (see Figures 49 and 50). The euro zone accounted for 48.6% of total exports in the first half of 2013, down from 60% in the whole of (pre-crisis) 2006.
Figure 49. Exports by sectors, first half of 2013 (% of the total)
| % of total | Change 2013/12 | Rep (1) | |
| Capital goods | 21.2 | 18.7 | 3.6 |
| Food | 15.1 | 6.7 | 1.0 |
| Automotive | 14.5 | 5.9 | 0.9 |
| Chemical products | 14.3 | 6.8 | 1.0 |
| Non-chemical semi-manufactured goods | 10.8 | -3.2 | -0.4 |
| Consumer manufactures | 8.4 | 11.9 | 1.0 |
| Energy products | 6.9 | 10.7 | 0.7 |
| Other goods | 4.8 | 0.4 | 0.0 |
| Raw materials | 2.7 | 4.3 | 0.1 |
| Consumer durables | 1.5 | 2.2 | 0.0 |
| Total | 100.0 | 8.0 | 8.0 |
(1) Contribution in percentage points to the growth in exports.
Source: Ministry of Economy and Competitiveness.
Figure 50. Distribution of exports by geographical areas, first half of 2013 (% of the total)
| % of total | Change 2013/12 | Rep (1) | |
| Europe | 69.4 | 4.5 | 3.2 |
| Euro zone | 48.6 | 4.7 | 3.0 |
| North America | 4.3 | 2.9 | 0.1 |
| Latin America | 6.2 | 9.4 | 0.6 |
| Asia | 9.1 | 18.1 | 1.0 |
| Middle East | 3.6 | 41.4 | 1.1 |
| Africa | 7.1 | 17.8 | 1.2 |
| Oceania | 1.1 | 36.3 | 0.3 |
| Total | 100.0 | 8.0 | 8.0 |
(1) Contribution in percentage points to the growth in exports.
Source: Ministry of Economy and Competitiveness.
Spanish direct investment abroad: a solid position
Net direct investment abroad began to pick up in the first half of 2013 after falling in the same period of 2012. The decline was largely due to the sale of assets no longer regarded as core, in some cases to reduce debt burdens, which was greater than new investment. Net productive investment (ie, excluding the Special Purpose Entities, known as ETVEs, whose sole purpose is to hold foreign equity and which provide tax advantages) amounted to €3.23 billion, 277.8% higher year-on-year. Of the €5.13 billion of gross investment excluding ETVEs in the first six months, half went into acquisitions, and the main recipient was the UK (see Figure 51). The three main sectors that received investment were banking and insurance (36% of the total), manufacturing (24.4%) and construction (13.8%).
Figure 51. Spanish gross direct investment abroad, first half of 2013, top ten countries (€ million and % of total) (1)
| €million | % change 2013/12 | % of total | |
| UK | 792 | +706.5 | 15.4 |
| Germany | 430 | +249.7 | 8.4 |
| Brazil | 410 | -19.2 | 8.0 |
| Colombia | 389 | +834.3 | 7.6 |
| Turkey | 378 | +190.1 | 7.4 |
| El Salvador | 371 | NA | 7.2 |
| Netherlands | 364 | +25.6 | 7.1 |
| Italy | 244 | +1.8 | 4.8 |
| Luxembourg | 228 | +221.5 | 4.4 |
| Switzerland | 199 | +9,044.4 | 3.9 |
(1) Excluding ETVEs.
Source: Foreign Investment Registry.
If this trend is maintained in the second half then the total stock of investment could rise after falling in 2012, for the first time since 1995, to US$627.2 billion from US$642.4 billion in 2011. In GDP terms, the stock represented 46.4% of GDP, slightly higher than Germany (see Figure 52).
Figure 52. Outward stock of Foreign Direct Investment, 2012 (% of GDP)
| France | Germany | Ireland | Italy | Spain | UK | |
| Outward | 53.9 | 45.6 | 170.5 | 28.1 | 46.4 | 74.4 |
Source: World Investment Report 2013, UNCTAD.
Spain’s leading listed companies continue to be dynamic and occupy leading global positions (see Figure 53).Those that form the Ibex-35 benchmark index of the Madrid Stock Exchange generated 62% of their revenues abroad in the first half of 2013, up from 60.4% in the same period of 2012 and almost double the figure of a decade ago. Total revenues were virtually unchanged at €230.2 billion (see Figure 54).
Figure 53. Spanish multinationals with the largest global market positions (1)
| Company | Industry | Global market position |
| Ebro Foods | Food processing | #1 trader/miller of rice, and 2ndproducer of pasta |
| Grupo SOS | Food processing | #1 producer of olive oil |
| Viscofán | Food processing | #1 producer of artificial casings for the meat industry |
| Freixenet | Sparkling wine | #1 producer of sparkling wine |
| Tavex | Textiles | #1 producer of denim |
| Inditex | Clothing | #1 fashion retailer by sales |
| Pronovias | Clothing | #1 maker of bridal wear |
| Acerinox | Steel | #1 producer of stainless steel |
| Repsol | Energy | #3 privately-owned shipper of liquefied gas (2) |
| Roca | Sanitary equipment | #1 maker of sanitary equipment |
| Grupo Antolín | Automobile components | #1 producer of interior linings |
| Zanini | Automobile components | #1 producer of wheel trims |
| Gamesa | Machinery | #4 manufacturer of wind turbines |
| Indo | Optical equipment | #3 manufacturer of lenses |
| Mondragón | Diversified | #1 worker-owned cooperative group |
| Iberdrola | Electricity | #1 wind farm operator |
| Grupo Ferrovial | Infrastructure | #7 developer & manager of transportation infrastructure (3) |
| ACS/Hochtief | Infrastructure | #1 developer & manager of transportation infrastructure (3) |
| Acciona | Infrastructure, renewable energy and water | #7 in wind energy and #8 in renewables (Bloomberg New Energy Finance) |
| Abertis | Infrastructure | #3 developer & manager of transportation infrastructure (3) |
| Telefónica | Telecom | #5 telecom operator by total customers and #3 by mobile customers (4) |
| Santander | Banking | #4 most valuable bank brand, largest bank by market capitalization in the euro zone, and #1 franchise in Latin America |
| Prosegur | Security | #3 company by sales |
| Sol Meliá | Hotels | #1 holiday hotel chain by number of beds |
| Real Madrid | Sports | #1 football club by revenue |
(1) Latest available.
(2) This position will change by the end of the year when Repsol sells LNG assets to Shell.
(3) Ranked by number of road, bridge, tunnel, rail, port and airport concessions over US$50 million investment value put under construction or operation as of 1 October 2012.
(4) This takes into account Telefónica’s acquisition of the Dutch KPN’s E-plus German mobile unit.
Source: compiled by William Chislett, Esteban García-Canal and Mauro F. Guillén from Interbrand, Public Works Financing, BrandFinance, Bloomberg New Energy Finance, the Spanish Business Council for Competitiveness and company reports.
Figure 54. International revenues of Ibex-35 companies, first half of 2013 (€ million and % of total revenues)
| Company | Sector | Total revenues (€ mn) | International (% of total) |
| Abengoa | Technology | 3,402 | 82.2 |
| Abertis | Motorways | 2,305 | 63.8 |
| Acciona | Construction | 3,255 | 41.2 |
| Acerinox | Metals | 2,072 | 91.2 |
| ACS | Construction & services | 19,121 | 84.6 |
| Amadeus IT Holding | Travel technology | 1,595 | 94.9 |
| Banco Popular | Banking | 2,574 | 8.0 |
| Banco Sabadell | Banking | 2,462 | 3.8 |
| Banco Santander | Banking | 26,373 | 80.6 |
| Bankinter | Banking | 744 | 0.0 |
| BBVA | Banking | 11,831 | 63.8 |
| BME | Stock market operator | 151 | 0.0 |
| Caixabank | Banking | 4,769 | 0.2 |
| Día | Supermarket chain | 4,864 | 54.8 |
| Enagás | Electricity | 631 | 1.9 |
| Endesa | Electricity | 15,087 | 38.3 |
| FCC | Construction | 3,134 | 41.9 |
| Ferrovial | Construction | 3,758 | 67.0 |
| Gas Natural | Gas | 12,895 | 44.9 |
| Grifols | Pharmaceutical | 1,381 | 92.1 |
| IAG | Airline | 8,039 | 86.9 |
| Iberdrola | Electricity | 16,836 | 53.7 |
| Inditex | Fashion retailer | 7,655 | 80.7 |
| Indra | Electronics | 1,490 | 57.5 |
| Jazztel | Telecoms | 487 | 0.0 |
| Mapfre | Insurance | 9,239 | 61.8 |
| Mediaset (Telecinco) | Media | 425 | 1.6 |
| OHL | Construction | 1,685 | 74.2 |
| Red Eléctrica | Electricity | 856 | 1.9 |
| Repsol | Oil | 29,144 | 50.9 |
| Sacyr-Vallehermoso | Construction | 1,679 | 52.0 |
| Técnicas Reunidas | Engineering | 1,395 | 96.4 |
| Telefónica | Telecoms | 28,563 | 76.9 |
| Viscofan | Artificial casings | 387 | 72.5 |
| Total | 230,283 | 62.0 |
Source: National Securities Market Commission.
Construction and infrastructure companies have become increasingly successful at winning contracts abroad, from building highways in the US to widening the Panama Canal (see Figure 55). Six Spanish companies are among the world’s top 10 largest transportation developers. In water, it is estimated that around 100 million people outside Spain receive water from companies with Spanish interests. The international business of these companies accounted in 2012 for 26% of turnover of €4.48 billion (see Figure 56).
Figure 55. International portfolio of Spanish construction companies, selected projects
| Project | Company | Country |
| LBJ Express highway | Ferrovial | US |
| Terminal T2A Heathrow | Ferrovial | UK |
| Crossrail tunnel | Ferrovial | UK |
| Light rail project | ACS | Canada |
| Firth of Forth bridge | ACS | UK |
| Shatin-Central railway link | ACS | Hong Kong |
| Panama Canal expansion | Sacyr | Panama |
| Two Metro stations Doha | OHL | Qatar |
| Bosphorus tunnel | OHL | Turkey |
| Mecca-Medina high speed train | OHL | Saudi Arabia |
| Three metro lines Riyadh | FCC | Saudi Arabia |
| Line 1 Panama City metro | FCC | Panama |
| Mersey bridge | FCC | UK |
| Electricity plant Baja California | Acciona | Mexico |
| Solar thermal plant Bokpoort | Acciona | South Africa |
Source: Company reports, prepared by El País. Information at June 2013.
Figure 56. Turnover of water companies, 2012 (€million)
| Total | Spain | International | |
| Agbar | 1,960 | 1,431 | 529 |
| Acciona | 506 | 425 | 81 |
| Aqualia (FCC) | 866 | 589 | 277 |
| Canal Isabel II Gestiona | 819 | 704 | 115 |
| Valoriza | 299 | 113 | 185 |
| CASSA | 31 | 30.6 | 0.4 |
| Total | 4,481 | 3,292.6 | 1,187.4 |
Source: Asoaga.
Spain’s global presence: holding firm
Spain’s crisis has not dented the country’s global presence; it remained in 11th position in the latest Elcano Global Presence Index, which measures the world-wide position of 60 countries on the basis of their economic, military and soft presence (see Figure 57).
Figure 57. Elcano Global Presence Index (IEPG) ranking (20 top positions)
| 2012 | 2011 | 1990 | ||||
| Position | Country | IEPG | Position | Δ | Position | Δ |
| 1 | US | 1,012.3 | 1 | = | 1 | = |
| 2 | Germany | 390.7 | 2 | = | 3 | +1 |
| 3 | UK | 347.5 | 3 | = | 5 | +2 |
| 4 | China | 308.4 | 5 | +1 | 13 | +9 |
| 5 | France | 297.5 | 4 | -1 | 4 | -1 |
| 6 | Russia | 243.7 | 7 | +1 | 2 | -4 |
| 7 | Japan | 237.4 | 6 | -1 | 6 | -1 |
| 8 | Netherlands | 218.3 | 8 | = | 9 | +1 |
| 9 | Canada | 194.1 | 9 | = | 8 | -1 |
| 10 | Italy | 171.5 | 10 | = | 7 | -3 |
| 11 | Spain | 162.8 | 11 | = | 10 | -1 |
| 12 | Saudi Arabia | 152.1 | 15 | +3 | 12 | = |
| 13 | Australia | 149.4 | 12 | -1 | 14 | +1 |
| 14 | South Korea | 146.1 | 13 | -1 | 19 | +5 |
| 15 | Belgium | 132.6 | 14 | -1 | 11 | -4 |
| 16 | India | 108.0 | 17 | +1 | 20 | +4 |
| 17 | Singapore | 106.3 | 16 | +1 | 25 | +9 |
| 18 | Switzerland | 97.0 | 18 | = | 15 | -3 |
| 19 | Brazil | 94.2 | 20 | +1 | 23 | +4 |
| 20 | Sweden | 87.7 | 19 | -1 | 17 | -3 |
Source: Elcano Royal Institute.
The index (IEPG, after its name in Spanish and now in its third edition), which is believed to be unique as other ones measure power or the degree of economic or political opening, seeks to show comprehensively the real and objective –as opposed to the perceived– presence of countries outside their borders in a wide variety of fields.[20]
Just over half of Spain’s contribution (50.4%) to its IEPG value comes from soft presence (see Figure 58), mostly tourism. Its main weakness is technology (see Figure 59).
Figure 58. Spain’s IEPG
| 1990 | 1995 | 2000 | 2005 | 2010 | 2011 | 2012 | |
| Economic presence | 11.4 | 18.1 | 25.2 | 46.5 | 63.5 | 67.7 | 77.8 |
| % IEPG | 27.4 | 34.4 | 37.0 | 44.1 | 44.1 | 44.2 | 47.5 |
| Energy | 1.1 | 0.4 | 1.5 | 3.1 | 3.7 | 4.6 | 4.7 |
| Primary goods | 2.4 | 5.1 | 5.6 | 9.9 | 12.9 | 14.4 | 18.9 |
| Manufactures | 2.8 | 4.6 | 5.8 | 9.7 | 10.8 | 11.7 | 14.4 |
| Services | 4.9 | 7.1 | 9.2 | 16.6 | 21.4 | 21.6 | 24.7 |
| Investments | 0.4 | 0.9 | 3.0 | 7.2 | 14.7 | 15.3 | 15.1 |
| Military presence | 2.4 | 2.5 | 2.6 | 3.0 | 3.4 | 3.6 | 3.5 |
| % IEPG | 5.8 | 4.8 | 3.8 | 2.9 | 2.4 | 2.3 | 2.1 |
| Troops | 0.0 | 0.3 | 0.6 | 0.5 | 0.6 | 0.6 | 0.6 |
| Military equipment | 2.4 | 2.2 | 2.0 | 2.5 | 2.8 | 2.9 | 2.9 |
| Soft presence | 27.9 | 32.0 | 40.3 | 56.0 | 77.1 | 81.9 | 82.6 |
| % IEPG | 66.8 | 60.9 | 59.2 | 53.1 | 53.5 | 53.5 | 50.4 |
| Migrations | 0.8 | 1.0 | 1.7 | 4.4 | 6.1 | 6.1 | 6.1 |
| Tourism | 20.0 | 18.7 | 24.8 | 29.9 | 27.9 | 28.1 | 30.3 |
| Sports | 1.5 | 4.8 | 2.8 | 5.8 | 8.3 | 8.3 | 8.3 |
| Culture | 1.2 | 0.5 | 1.0 | 2.3 | 3.9 | 3.6 | 4.8 |
| Information | 0.0 | 0.0 | 0.1 | 1.0 | 8.6 | 14.5 | 14.5 |
| Technology | 0.7 | 0.8 | 1.1 | 1.1 | 1.5 | 1.5 | 1.5 |
| Science | 1.4 | 2.4 | 3.3 | 4.7 | 6.5 | 5.6 | 6.1 |
| Education | 0.8 | 1.8 | 3.4 | 1.5 | 4.0 | 4.6 | 4.6 |
| Development cooperation | 1.5 | 2.1 | 2.1 | 5.2 | 10.4 | 9.4 | 6.2 |
| IEPG value | 41.8 | 52.4 | 68.0 | 105.0 | 143.4 | 152.3 | 162.8 |
| Position | 10 | 10 | 11 | 11 | 11 | 11 | 11 |
Source: Elcano Royal Institute.
Figure 59. Spain: strengths and weaknesses, contribution to IEPG 2012 value
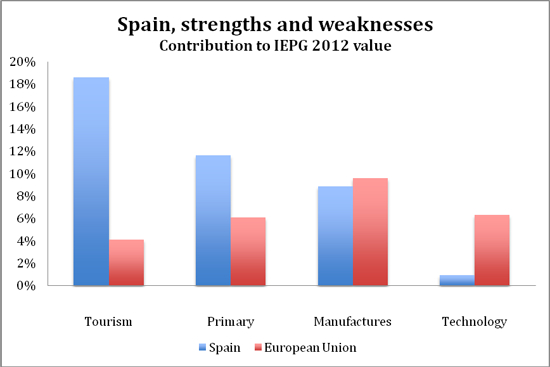
Source: Elcano Royal Institute.
Spain has quickly reinserted itself in the international community in the last 30 years: its IEPG value almost quadrupled between 1990 and 2012 (from 41.8 to 162.8), compared with increases for the US and Portugal of 112% and 232%, respectively.
In a separate ranking, Elcano looks at the intra-European presence of EU countries (IEPE). Spain is ranked 5th (see Figure 60).
Figure 60. Elcano European Presence Index (IEPE) ranking
| 2012 | 2005 | |||
| Position | Country | IEPE | Position | Country |
| 1 | Germany | 706.7 | 1 | = |
| 2 | UK | 654.7 | 2 | = |
| 3 | France | 519.6 | 3 | = |
| 4 | Netherlands | 442.2 | 4 | = |
| 5 | Spain | 302.9 | 7 | +2 |
| 6 | Italy | 279.9 | 6 | = |
| 7 | Belgium | 272.2 | 5 | -2 |
| 8 | Luxembourg | 157.3 | 17 | +9 |
| 9 | Sweden | 151.8 | 8 | -1 |
| 10 | Austria | 135.9 | 9 | -1 |
| 11 | Ireland | 123.8 | 11 | = |
| 12 | Denmark | 108.4 | 10 | -2 |
| 13 | Poland | 100.8 | 13 | = |
| 14 | Czech Republic | 82.1 | 14 | = |
| 15 | Hungary | 79.9 | 12 | -3 |
| 16 | Portugal | 61.6 | 18 | +2 |
| 17 | Finland | 59.6 | 15 | -2 |
| 18 | Greece | 50.7 | 16 | -2 |
| 19 | Romania | 35.7 | 19 | = |
| 20 | Slovakia | 35.6 | 20 | = |
| 21 | Bulgaria | 22.3 | 21 | = |
| 22 | Lithuania | 20.5 | 22 | = |
| 23 | Slovenia | 20.4 | 23 | = |
| 24 | Estonia | 14.6 | 24 | = |
| 25 | Latvia | 11.3 | 25 | = |
| 26 | Cyprus | 10.1 | 26 | = |
| 27 | Malta | 5.5 | 27 | = |
Source: Elcano Royal Institute.
Inward foreign direct investment: on the rise
Net foreign direct investment picked up a little in the first half of 2013 to €4.92 billion, 4.4% more than in the same period of 2012 and excluding the Special Purpose Entities (ETVEs) whose sole purpose is to hold foreign equity. Of the €6.81 billion of gross investment excluding ETVEs, 16.3% went into acquisitions and 82% into capital. The main investor country was France (see Figure 61).
Figure 61. Foreign direct investment in Spain, first half of 2013, top ten countries (€ million and % of total) (1)
| €million | % change 13/12 | % of total | |
| France | 1,598 | +352.5 | 23.4 |
| Luxembourg | 1,094 | +117.9 | 16.0 |
| Netherlands | 558 | -24.5 | 8.2 |
| UK | 469 | -2.9 | 6.9 |
| US | 375 | -75.8 | 5.5 |
| Mexico | 283 | 546.5 | 4.2 |
| Spain (2) | 335 | -61.0 | 4.9 |
| Germany | 267 | -76.3 | 3.9 |
| Belgium | 240 | +626.5 | 3.5 |
| Hong Kong | 236 | +488.0 | 3.5 |
(1) Excluding ETVEs.
(2) Those soperations which mainly for tax reasons Spanish companies conduct via their subsidiaries in third countries.
Source: Foreign Investment Registry.
More than a dozen multinationals have announced investments this year to increase production including the car companies Renault-Nissan, Ford, Iveco and Seat, the pharmaceutical company Boehringer, the paper company Smurfi Kappa and Nestlé.
The stock of inward investment stood at US$634.5 billion at the end of 2012, up from US$622.0 in 2011. In GDP terms, the inward stock accounted for 47% of GDP, more than double that of Italy (see Figure 62).
Figure 62. Inward stock of foreign direct investment, 2012 (% of GDP)
| France | Germany | Ireland | Italy | Spain | UK | |
| Inward | 39.5 | 21.1 | 142.1 | 17.7 | 47.0 | 54.4 |
Source: World Investment Report 2013, UNCTAD.
An important factor that is making the economy more attractive to foreign investors is the correction in unit labour costs (ULCs), which rose excessively during the boom period. These costs, a component of cost competitiveness, have been on a downward trend since 2008 (see Figure 63). Spain’s ULCs were unchanged in the second quarter of 2013.
Figure 63. Unit labour costs, (2000 = 100)
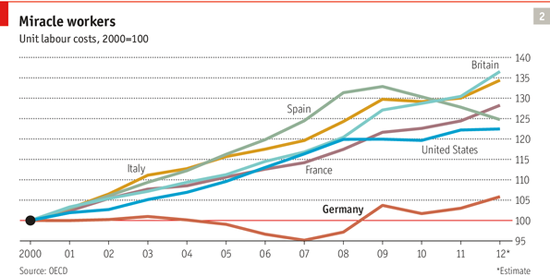
This improvement reflected wage freezes and cuts and enhanced productivity. Spain’s labour costs (wages and salaries plus non-wage costs such as employers’ social security contributions) rose 8.3% between 2008 and 2012, below the euro zone average and last year dropped slightly (see Figure 64).
Figure 64. Labour costs per hour, 2008-12, for the whole economy excluding agriculture and public administration (€)
| 2008 | 2009 | 2010 | 2011 | 2012 | % change 2012/08 | |
| France | 31.2 | 31.6 | 32.5 | 33.6 | 34.2 | 9.5 |
| Germany | 27.9 | 28.6 | 28.8 | 29.6 | 30.4 | 9.1 |
| Italy | 25.2 | 26.1 | 26.7 | 27.1 | 27.4 | 8.9 |
| Spain | 19.4 | 20.5 | 20.7 | 21.2 | 21.0 | 8.3 |
| UK | 20.9 | 18.8 | 20.0 | 20.1 | 21.6 | 3.3 |
| Euro zone | 25.7 | 26.4 | 26.9 | 27.5 | 28.0 | 8.7 |
Source: Eurostat.
Investors, foreign as well as domestic, have also drawn comfort from the government‘s move to make business easier in the fragmented domestic market by passing legislation, which allows goods and services produced under just one of the 17 different regional regulations to be supplied throughout the entire country without additional paperwork. The law, expected to be approved by parliament by the end of 2013, is based on the principles of single licence and legislation of origin.
Competitiveness: costs improving, other factors still lagging
Spain rose one notch in the World Economic Forum’s Global Competitiveness Index 2013-14 to 35th place, but its already low position in three of the 12 categories that determine the overall rankings –macroeconomic environment, financial market development and labour market efficiency– worsened (see Figures 65 and 66). In the case of macroeconomic fundamentals and financial market development, the deterioration stemmed from the country’s still unresolved crisis, though progress has been made in both areas, and in the other one, the impact of labour market reforms has yet to be felt and the measures are also considered to be insufficient. The rankings are based on data in some areas and perceptions in others (drawn from surveys).
Figure 65. The Global Competitiveness Index 2013-14 rankings and 2012-13 comparisons
| Country | 2013-14 rank out of 148 | 2012-13 rank out of 144 |
| Switzerland | 1 | 1 |
| Finland | 2 | 2 |
| Germany | 4 | 6 |
| US | 5 | 7 |
| UK | 10 | 8 |
| France | 23 | 21 |
| Spain | 35 | 36 |
Source: World Economic Forum.
Figure 66. Components of the Global Competitiveness Index
| Rank (out of 148) | Rank (out of 144) | |
| Basic requirements (20% of the index) | 3836 | |
| Institutions | 58 | 48 |
| Infrastructure | 10 | 10 |
| Macroeconomic environment | 116 | 104 |
| Health and primary education | 30 | 36 |
| Efficiency enhancers (50% of the index) | 2829 | |
| Higher education and training | 2629 | |
| Goods market efficiency | 6355 | |
| Labour market efficiency | 115 | 108 |
| Financial market development | 97 | 82 |
| Technological readiness | 26 | 26 |
| Market size | 14 | 14 |
| Innovation and sophistication factors (30%) | 32 | 31 |
| Business sophistication | 33 | 32 |
| Innovation | 34 | 35 |
Source: Global Competitiveness Reports, World Economic Forum.
The three most problematic factors for doing business are access to financing (138th), inefficient government bureaucracy and restrictive labour regulations. While Spain has obtained access to international financing markets at a more affordable cost –most visibly seen in the significant reduction in the risk premium of 10-year Spanish government bonds over German equivalents– this has not resulted in easier access to loans for local companies, which still suffer from a very tight credit squeeze. The yield on these bonds, which move inversely to prices, was below 4.20% in early October 2013, down from a peak of 7.75% in July 2012. The average interest rate paid on debt issued by Spain’s Treasury was 2.61% in just over the first eight months of the year. Since the launch of the euro in 1999, Madrid’s funding costs have only been lower in 2009 and 2010 –when its credit rating was higher–.
The country’s main strength is its world-class transport infrastructure (6th), and –despite the very high unemployment rate– a large and skilled labour force, thanks to one of the highest tertiary education enrolment rates (8th). Spain scores particularly well in availability of scientists and engineers (18th). However there are nowhere near enough jobs for them as Spain’s economy is a long way from being knowledge-based. The country’s capacity to retain talent is ranked 102nd, down from 82nd in 2012-13. The substantial drop in this ranking underscores Spain’s brain drain: bright young scientists are increasingly working abroad. Spain’s distance from innovation-drive economies is shown in see Figure 67.
Figure 67. Spain: distance from innovation-drive economies
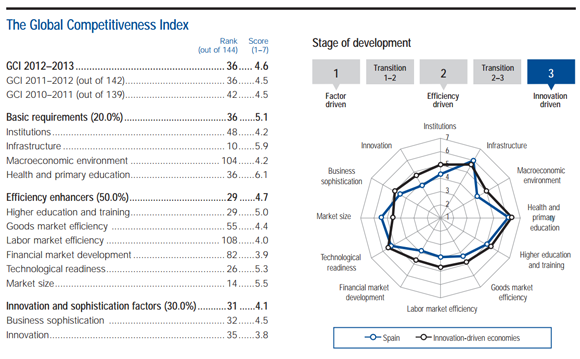
Conclusion: has Spain turned the corner?
The macroeconomic figures are generally speaking looking much better, but the unemployment rate remains very high and will do so for as long as Spain continues to have a dysfunctional labour market system. A sustained economic and employment recovery will only march hand in hand when the labour market is reformed along the lines applied by countries able to create jobs even in periods of slow economic growth.
- The economy shrank by ‘only’ 0.1% in the second quarter over the first quarter, the slowest pace of decline in two years. Technically speaking, the country could be out of recession by the end of the year.[21]
- Exports continue to boom.
- The number of tourists this year will set a new record.
- The overall balance of payments (current and capital accounts) in the first half notched up its first surplus since 1997.
- Net foreign direct investment in Spain is on the rise.
- Bank results are finally beginning to improve.
- Almost two-thirds of the revenues of the companies that form the Ibex-35 benchmark index of the Madrid Stock Exchange were generated abroad in the first half of the year.
- The risk premium –that term that even taxi drivers are knowledgeable about– on 10-year government bonds over German equivalents has dropped substantially.
- The Madrid stock market has become bullish.
All of this is music to the ears of the government’s economic team, the troika (the European Commission, the European Central Bank and the International Monetary Fund) that has Spain under its tutelage, analysts and foreign investors. Job creation, however, is bleak, gross public debt continues to rise and also the ratio of non-performing loans of banks.
The government, by and large, has stuck to its guns and done what it said it would do and also what it said it would not do (for example, raising taxes), but then what political party has not broken its campaign promises, especially after winning power and looking at the dreadful state of the public accounts?
When a government begins to see some light in the tunnel (in Spain’s case a long one) there is always the temptation to ease up and believe its job is finished, particularly with elections on the horizon. This would only store up problems for the future. Without further reforms, Spain will not improve its boom-bust dynamics.
The PP faces a general election no later than November 2015. The Socialists, for the first time since the PP took power at the end of 2011, would very narrowly win if it was held now, according to a Metroscopia poll, but they would be far from an absolute majority. In all likelihood, the next government will be a coalition and not necessarily led by the Socialists, as the economic improvements could sway voters back to the PP.
Prime Minister Mariano Rajoy claimed in September 2013 that ‘Spain is out of recession but not out of the crisis’.[22] The government cannot afford to rest on its laurels and relax the pace of reforms. To do so, would store up problems for the future.
William Chislett
Associate Researcher at the Elcano Royal Institute, author of ‘Spain: What Everyone Needs to Know’, published by Oxford University Press in September 2013
www.williamchislett.com
Selected bibliography
Bank of Spain (2012), 2012 Annual Report.
Business Competitiveness Council (2013), Spain: A Land of Opportunity, Madrid, March.
Chislett, William (2013), Spain: What Everyone Needs to Know, Oxford University Press, New York.
Dolado, Juan J. (2012), ‘The Pros and Cons of the Latest Labour Market Reform in Spain’, Spanish Labour Law and Employment Relations Journal, April-November, vol. 1, nr 1-2, pp. 22-30.
European Commission (2013a), ‘Commission staff working document: In-depth review for Spain’, Brussels, 10/IV/2013.
European Commission (2013b), ‘Commission staff working document: Assessment of the 2013 national reform programme and stability programme for Spain’, Brussels, 29/V/2013.
Eurogroup, ‘Memorandum of Understanding on Financial Policy Conditionality’, 20/VII/2012.
García de Quevedo Ruiz, José Carlos, & Lucía García Callealta (2013), “El mercado y otros factores de competitividad para la atracción de inversions directas extranjeras”, ICE magazine, nr 871, March-April.
Herce, José Antonio (2012), ‘Una asignación equivocada. ¿Por qué la crisis está siendo tan profunda?’, Revista Asturiana de Economía, nr 46.
IMF, Progress reports on Spain’s financial sector reform.
Maudos, Joaquin (2012), ‘Financial soundness indicators for the Spanish banking sector: An international comparison’, FUNCAS, Spanish Financial and Economic Outlook, vol. 1, nr 4, November 2012.
Molinas, César. ¿Qué hacer con España?, Barcelona, Destino, 2013.
Morgan Stanley. The New Spain, 9 September, 2013.
Muñoz Molina, Antonio. Cuando todo era sólido, Barcelona, Seix Barral, 2013.
OECD (2012), 2012 Survey of Spain.
OECD (2013a), Education at a Glance 2013.
OECD (2013b), International Migration Outlook 2013.
Powell, Charles (2012), The Pain in Spain: Madrid and the European Financial Crisis, Elcano Royal Institute, Madrid, 31/XII/2012; an earlier version of this article was first published under the title ‘The pain in Spain: Madrid and the European Financial Crisis’, in Various Authors, Southern Europe in Trouble. Domestic and Foreign Policy Challenges of the Financial Crisis, Mediterranean Paper Series, The German Marshall Fund of the United States.
Rosell, Juan (2013), Reformas o declive, Ediciones Deusto, Barcelona.
Royo, Sebastian (2013), Lessons from the Economic Crisis in Spain, Palgrave Macmillan, New York.
Spain’s Ministry of Finance and Public Administrations (2913), Reforma de las Administraciones Públicas, June.
[1] The author would like to thank the following for their help in preparing this report: María Luisa Blázquez de la Hera, Julio Carabana, Miguel Cardoso, Fernando Casado, Fernando Fernández, Domingo García, Carmen González Enríquez, José Luis González Vallvé, Ferdi Grafe, Justin Harman, Jorge Hay, José Antonio Herce, Emilio Lamo de Espinosa, César Molinas, Mariano Morcate, Valeriano Muñoz, Antonio Muñoz Vico, Miguel Otero, Víctor Pérez-Díaz and María Romero Paniagua.
[2] This contentious issue is well explained in ‘Youth unemployment in Spain’ by Carmen González Enríquez.
[3] See ‘Spain Needs to Deliver on Reforms to Stabilize Economy’.
[4] Vicente Cuñat & Luis Garicano (2009), ‘Did Good Cajas Extend Bad Loans? The Role of Governance and Human Capital in Cajas’ Portfolio Decisions’, FEDEA Monograph, ‘The Crisis of the Spanish Economy’, November. Cited in the IMF report ‘The Reform of Spanish Savings Banks’, May 2012.
[5] Including 900,000 naturalised Spaniards, the total number of immigrants (ie, foreign-born) was 6.4 million in January 2013 (13.5% of the population).
[6] See the revealing analysis by Carmen González Enríquez ‘¿Emigran los españoles?’.
[7] This indicator reflects the lack of at least four of the following variables: mortgage or rent; a week’s holidays away from home; eating meat, chicken or fish every two days; the possibility of covering unexpected financial costs; telephone; colour TV; washing machine; and car and heating.
[8] Data for 2008, the last year before Spain entered recession. See ‘La economía sumergida en España’ by Alfredo Jiménez and Ramiro Martínez-Pardo del Valle, working document 4, Fundación de Estudios Financieros.
[9] The Socialist government’s target for 2011 was 6% and the deficit came in at 8.5%. Eurostat, the EU’s statistics office, then revised the figure upward to 9.4% to reflect state injections of capital into nationalised banks and also the deficit in 2010 from 9.3% to 9.7% to take account of a backlog of unpaid bills by public administrations.
[10] The Bank of Spain put the general government’s gross liabilities at 112.1% of GDP at the end of 2012, rather than 84.2%. The main reason for the difference has to do with Spain’s ‘unpaid bills’ and various off-balance sheet liabilities. The narrower measurement, according to the excessive deficit procedure, does not capture such variables.
[11] See ‘Asset Quality Review and Bottom-up Stress Test Exercise’.
[12] See ‘Stress Testing Spanish Banks’.
[13]See ‘The Pros and Cons of the Latest Labour Market Reform in Spain’ for a clear explanation of the labour market situation.
[14] The Public Works Ministry usually publishes the figure around July for the previous year, but had still not released it when this report went to press in October.
[15] The explanation of how the ‘sustainability factor’ works is taken from the IMF’s 11 July 2013 report on Spain.
[16] Another factor behind the high school-leaving rate, which is rarely mentioned, is that the bar for assessing exams is higher in Spain. This is revealed by comparing Spain’s results in the PISA tests for 15-year-olds with early school leaving rates. France, for example, has very similar PISA results to Spain and yet its early school-leaving rate is half of Spain’s. See the analysis by Carmen González Enriquez at ‘El engañoso fracaso escolar’.
[17] See ‘Sistema educativo y ciencia’ by the sociologist Juan Díez Nicolás, published by the Fundación de Estudios Financieros (http://www.fef.es/new/index.php), which provides personal experience of the problems. Diéz Nicolás, emeritus professor of the Complutense University, Madrid, has a long and distinguished career at many levels of education including teaching in a state secondary school and abroad.
[18] A good example of this is that it took the Constitutional Court seven years to uphold the legality of same-sex marriage, after dismissing in November 2012 the appeal presented by the Popular Party filed after the Socialists legalised it in 2005. The Court offered no explanation as to why it took an inordinate amount of time for what was not a complex issue. In another case, Carlos Fabra, the former president of the Castellón district council for 16 years and of the Popular Party in that area, appeared in court in October 2013 on charges of bribery, tax fraud and trafficking of influences, 10 years after he was first investigated. Fabra is well known as there isa 24-metre-high statue dedicated to him at the ‘ghost’ Castellón airport, crowned by an aluminium model aircraft. Fabra inaugurated the €150 million airport in 2011, and there have been no flights since then.
[19] Quoted in ‘Political Inquiry Makes Judge a Star, as It Reveals Flaws in Spain’s Courts’,New York Times, 30/VII/2013, by Raphael Minder..
[20] See the following two reports by Iliana Olivié & Manuel García, which explain the IEPG: ‘What would the ‘United States of Europe’ look like in this changing world? Reflections on the IEPG’ and ‘IEPG 2012: methodology and new analytic tools’.
[21] A recession is defined as two successive quarters of negative growth.
[22] See his interview in the Wall Street Journal on 23 September.
