

Theme: Spain’s striking export success has enabled the economy to emerge from recession and helped to turn around the current-account balance. Structural adjustment is shifting the engine of the economy from domestic sources of growth into an export-led model.
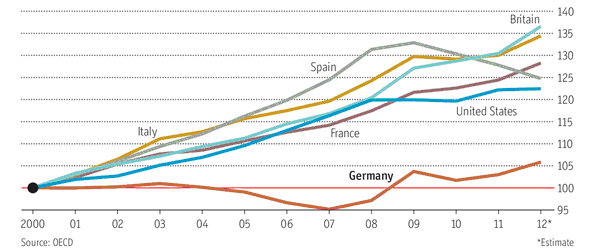
Summary[1] :Exports of goods have risen significantly in the last five years. External demand has been positive since 2008, having been negative for the previous 10 years. Both the destination and the structure of exports have changed, with a larger share going to non-EU countries. The share of exports in GDP is converging towards Germany at a faster pace than in France and Italy, moving the engine of economic growth away from its previous over-dependence on domestic sources, particularly construction.
Export growth has been spurred by productivity gains and restored cost competitiveness. The sharp rise in unemployment has reduced wages in real terms and lowered unit labour costs. The government’s labour-market reforms have also enabled companies to negotiate wages and working conditions more flexibly. These factors, in turn, have spurred foreign direct investment in Spain, some of which has gone to major exporting industries, notably automotive companies.
While the US, the UK, Germany, France and Italy have all lost global market export share to varying degrees, mainly to China and other emerging countries, Spain’s share of world merchandise exports has remained virtually unchanged.
The government’s is a keen supporter of the free trade and investment agreement between the EU and the US, known as the Transatlantic Trade and Investment Partnership (TTIP).
The signs are promising that the adjustment is structural and not just cyclical.
Analysis: Merchandise exports grew from €160 billion in 2009, when the economy shrank by close to 4%, to €226 billion in 2012 (GDP growth of -1.7%), an increase equivalent to more than 5% of GDP, as companies sought to compensate for plummeting sales in the depressed domestic market (see Figure 1). This growth has been faster than the paces of Germany and France, albeit from a smaller base, and continued this year. Exports were almost 7% higher in the first nine months of 2013, making it possible for the whole year figure to continue to notch up another record. Exports of goods and services have risen from 27% of GDP in 2007, the last year of strong economic growth, to between 33% and 35% this year. Even though GDP has shrunk during the period, this is still a notable achievement. The share of exports in GDP in Spain is converging towards Germany (52% in 2012) faster than in France and Italy.
Imports, however, have also risen but at a slower pace; they increased from €206 billion to €258 billion between 2009 and 2012, mainly because of the high energy bill. Exports covered 88% of imports last year, up from 77.6% in 2009, and coverage was 94% in the first nine months of 2013.
Figure 1. Main foreign trade magnitudes, 2007-13
| Exports (€ bn) | Imports (€ bn) | Balance (€ bn) | Coverage (%) (2) | |
| 2007 | 185.0 | 285.0 | -100.0 | 64.9 |
| 2008 | 189.2 | 283.4 | -94.2 | 66.8 |
| 2009 | 159.9 | 206.1 | -46.2 | 77.6 |
| 2010 | 186.8 | 240.0 | -53.2 | 77.8 |
| 2011 | 215.2 | 263.1 | -47.9 | 81.8 |
| 2012 | 226.1 | 257.9 | -31.8 | 87.7 |
| 2013 (1) | 175.1 | 186.1 | -11.0 | 94.1 |
(1) First nine months.
(2) Percentage of imports covered by exports.
Source: Ministry of Economy and Competitiveness.
The lower trade deficit (€11 billion in the first nine months compared with €100 billion for the whole of 2007 at the peak of the boom when the country was living beyond its means) has helped to turn a staggering current-account deficit of 10% of GDP in 2007 into a surplus (for the first time in 26 years) estimated at more than 1% this year.
This turnaround is unprecedented in modern Spanish economic history, and is due to structural and not just cyclical factors. The country has gone through three current-account adjustments before the current crisis (in 1977, 1983 and 1992) but they were all much less challenging. In these episodes, the current-account deficits at the beginning of the respective crises were only between 2.6% and 4% of GDP.[2]
But for the positive contribution of external demand since 2008, when the economy took a nosedive after a long boom period, Spain’s recession would have been deeper. The country emerged from recession in the third quarter of this year, albeit with miniscule growth of 0.1% quarter-on-quarter. The country’s structural problem is that external demand has traditionally only been positive when the economy is in the doldrums, as Figure 2 shows. Between 1988 and 2013, the contribution of external demand to GDP growth was positive in only eight years (six of them since 2008). Economic growth was fuelled, particularly after Spain became a founder member of the euro in 1999, by cheap credit and excessive activity in the real estate and construction sectors, creating a lopsided economy.
External demand’s largest contribution was in 1993, when Spain suffered its last recession, mild and short-lived compared with the current one. The challenge for Spain is to achieve a better balance between the different components of its economy in which exports play a greater and strategic role, like Germany. This is beginning to happen.
Figure 2. Contribution of domestic and external demand to GDP growth (annual % change)
| GDP growth | Domestic demand | External demand | |
| 1988 | +5.2 | +7.1 | -1.9 |
| 1990 | +3.7 | +5.0 | -1.3 |
| 1993 | -1.2 | -4.5 | +3.4 |
| 1997 | +3.9 | +3.4 | +0.5 |
| 2000 | +5.0 | +5.4 | -0.4 |
| 2001 | +3.6 | +3.9 | -0.3 |
| 2002 | +2.7 | +3.3 | -0.6 |
| 2003 | +3.1 | +3.9 | -0.8 |
| 2004 | +3.3 | +4.9 | -1.6 |
| 2005 | +3.6 | +5.3 | -1.6 |
| 2006 | +4.0 | +5.5 | -1.5 |
| 2007 | +3.6 | +4.4 | -0.8 |
| 2008 | +0.9 | -0.6 | +1.5 |
| 2009 | -3.8 | -6.7 | +2.9 |
| 2010 | -0.2 | -0.6 | +0.4 |
| 2011 | +0.1 | -2.0 | +2.1 |
| 2012 | -1.7 | -4.1 | +2.5 |
| 2013 (forecast) | -1.2 | -3.2 | +1.9 |
| 2014 (estimate) | +0.5 | -3-2 | +1.5 |
Note: differences are due to rounding.
Source: National Statistics Office (INE) for 1988-2012 and Analistas Financieros Internacionales (Afi) for 2013 and 2014.
The comparison with 1993, however, is tenuous because until Spain joined the euro in 2002 it could resort to the policy option of devaluing its currency, the peseta, in order to restore or boost export competitiveness. The peseta was devalued seven times between 1959 and 1993 (three of them in the 1990s). This option disappeared with entry into the euro; since then competitiveness can only be enhanced through the so-called internal devaluation, essentially by lowering wage costs and profit margins, increasing productivity and improving the price/quality relationship, all of which has happened in the last few years.
Productivity gains, resulting from the sharp rise in unemployment (from 8.3% in 2007 to 26% in 2013) and a consequent decline in real terms in wages, have lowered unit labour costs which have been on a downward trend since the middle of 2008, both for the economy as a whole and for the manufacturing sector (see Figure 3). The government’s labour-market reforms have also enabled companies to negotiate wages and working conditions more flexibly. These factors, in turn, have spurred foreign direct investment in Spain (gross inflows of US$27.7 billion in 2012, higher than Germany, France and Italy), some of which has gone to major exporting industries, notably automotive companies.
Figure 3. Unit labour costs, (2000 = 100)
Spain’s total factor productivity increased the most among the large euro zone economies in 2008-12, eroding Germany’s advantage (see Figure 4).
Figure 4. Average annual change in total factor productivity, 1991-2012
| Germany | France | Italy | Spain | UK | US | |
| 1991-98 | 0.5 | 1.0 | 1.1 | 0.4 | 2.0 | 1.5 |
| 1999-2007 | 0.8 | 0.4 | 0.2 | -0.1 | 1.6 | 0.8 |
| 2008-12 | -0.1 | -0.3 | -0.7 | 0.4 | -0.6 | 0.8 |
Source: European Commission AMECO database and Deutsche Bank.
Not only have exports grown, but their composition by sectors and markets has also changed. The EU took 70.1% of Spain’s exports at the peak of the economic boom compared with 62.2% in the first nine months of 2013 (the euro zone’s share dropped from 56% to 50%). Asia’s share of exports increased from 6.2% in 2007 to 8.5% in 2012 (total exports rose from €185 billion to €226 billion in 2012) and to 9.1% in the first nine months of 2013 (year-on-year exports grew from €167.6 billion to €175 billion). The proportion of exports going to Africa rose from 4.5% in 2007 to 6.8% in 2012 and 7.1% in the first nine months of 2013 (see Figure 5).
In absolute terms, this means that exports to Asia were worth €11.4 billion in the whole of 2007 and close to €16 billion in the first nine months of 2013. Those to Africa increased from €8.7 billion to €15.3 billion in 2012 and €12.4 billion in the first nine months of 2013. Exports to Asia in the first nine months were more than twice those to North America, a market whose share of total Spanish exports has remained virtually unchanged at less than 5% since 2007.
Figure 5. Distribution of merchandise exports by geographical areas, first nine months of 2013 (% of the total)
| % of total | Change 2013/2012 | Contribution (1) | |
| Europe | 69.3 | 4.5 | 3.2 |
| Euro zone | 48.6 | 4.0 | 2.0 |
| France | 16.0 | 3.9 | 0.6 |
| Germany | 10.1 | 2.9 | 0.3 |
| Italy | 7.1 | 2.0 | 0.1 |
| North America | 4.2 | -2.1 | -0.1 |
| US | 3.8 | -0.8 | 0.0 |
| Latin America | 6.5 | 10.7 | 0.7 |
| Brazil | 1.6 | 33.3 | 0.4 |
| Asia | 9.1 | 15.8 | 1.3 |
| China | 1.7 | 11.6 | 0.2 |
| Middle East | 3.5 | 32.1 | 0.9 |
| Africa | 7.1 | 14.2 | 0.9 |
| Oceania | 1.0 | -4.5 | -0.1 |
| Total | 100.0 | 6.8 | 6.8 |
(1) Contribution in percentage points to the growth in exports.
Source: Ministry of Economy and Competitiveness.
As regards the structure by sectors, the share of food exports in total exports rose from 13.7% in 2007 to 15.3% in 2012 and 14.9% in the first nine months of 2013 (see Figure 6). Capital goods have held their position at around 20% of total exports and the share of chemical products has increased a little. Over one-third of Spanish exports are in industrial intermediate products and are part of an international supply chain that feeds into other countries’ final products. This belies the country’s traditional image, which it has yet to shake off completely, of an exporter of mainly vegetables, fruit and wine. Since joining the EU in 1986, Spain has exported an increasingly diversified range of products, from oddities such as doughnuts to cars, information and air traffic control systems (Indra) and space navigation equipment (GMV). Sectors with a high technological component, however, are under-represented in the structure of exports. To some extent this reflects Spain’s low investment in R&D, which at 1.3% of GDP is well below the EU average (2%) and almost less than one-third that of high-tech countries such as Finland.
Figure 6. Distribution of merchandise exports by sector, first nine months of 2013 (% of the total)
| Sector | % of total | Change 2013/12 | Contribution (1) |
| Capital goods | 20.8 | 15.3 | 3.0 |
| Food | 14.9 | 7.0 | 1.0 |
| Chemical products | 14.4 | 6.3 | 0.9 |
| Automotive | 14.0 | 8.3 | 1.2 |
| Non-chemical semi-manufactured goods | 11.0 | -1.1 | -0.1 |
| Consumer manufactures | 8.8 | 11.5 | 1.0 |
| Energy products | 7.0 | 4.3 | 0.3 |
| Other goods | 4.9 | -10.4 | -0.6 |
| Raw materials | 2.7 | 5.9 | 0.2 |
| Consumer durables | 1.5 | 1.1 | 0.0 |
| Total | 100.0 | 6.8 | 6.8 |
(1) Contribution in percentage points to the growth in exports.
Source: Ministry of Economy and Competitiveness.
Vehicle manufacturers, which accounted for 14% of total exports in the first nine months of 2013, have been able to offset low sales in the domestic market with significant exports (see Figure 7). The motor industry has held its costs down and boosted productivity, making it more competitive. Plants have received €3.5 billion of investment and aim to boost the number of models manufactured from 34 in 2011 (39 in 2013) to 45 in 2015.
Figure 7. Production and exports of vehicles, 2008-13 (million)
| Total production | Exports | As % of output | |
| 2008 | 2.54 | 2.18 | 85.8 |
| 2009 | 2.17 | 1.88 | 86.6 |
| 2010 | 2.38 | 2.07 | 86.9 |
| 2011 | 2.37 | 2.12 | 89.4 |
| 2012 | 1.97 | 1.72 | 87.3 |
| 2013 (1) | 1.83 | 1.59 | 86.8 |
(1) First 10 months.
Source: Anfac.
The bulk of exports, however, are concentrated in a small number of companies. The 100 largest exporters out of a total of 136,933 in 2012 (101,393 in 2008), according to the foreign trade institute ICEX, accounted for 40.5% of the total value of exports (see Figure 8). While the total number of exporters rose by 35% between 2008 and 2012 to 136,933, the number of regular exporters (more than four consecutive years) dropped over the same period from 39,641 to 38,341. The number was higher, however, in the first eight months of 2013 at 39,704 and is expected to continue to rise as companies meet the regular exporter definition.
Of the total number of exporters in 2012, 68,014 sold goods worth less than €5,000. These are part of Spain’s SMEs, the backbone of the economy, which account for close to 40% of total employment. One of the challenges facing the country is to incorporate SMEs into the value chain of much larger exporting companies, in the way that vehicle component firms have been successfully integrated into vehicle producers. A notable example of this is Volkswagen which has plants in Spain and Germany.
Figure 8. Cumulative percentage of exports by number of companies (% of export volume)
| 2010 | 2011 | 2012 | 2013 (1) | |
| 5 largest | 9.5 | 9.0 | 10.1 | 10.4 |
| 10 largest | 14.9 | 14.2 | 14.9 | 16.5 |
| 25 largest | 22.7 | 23.2 | 23.4 | 25.7 |
| 50 largest | 30.5 | 32.3 | 32.3 | 33.4 |
| 100 largest | 38.1 | 40.3 | 40.5 | 41.5 |
| 500 largest | 57.3 | 59.0 | 59.3 | 60.2 |
| 1,000 largest | 66.6 | 68.0 | 68.2 | 68.8 |
| Total | 100.0 | 100.0 | 100.0 | 100.0 |
(1) First eight months.
Source: ICEX.
The export success is such that Luis de Guindos, Spain’s Economy Minister, let it be known that he does not share the international criticism of Germany’s huge trade and current account surpluses.[3] Germany’s export boom is a fillip for Spain because a large share of Spain’s total merchandise exports (10% in the first nine months of 2013) go to the euro zone’s powerhouse. Half of these exports are intermediate goods. Car parts and chemicals, for example, are used to create finished products that are then sold overseas.
Spain, according to a report by Deutsche Bank Securities,[4] is turning ‘German’ as it is converting from an ‘extensive growth model’, on the basis of large quantities of capital and labour into the least productive sectors of the economy (construction) without raising the country’s growth potential, into a ‘lean growth model’.
Moreover, Spanish companies, even when correcting for their still high degree of leverage, are now in a fairly favourable financial position vis à vis France and Italy whose businesses are less indebted and are the closest to Germany among the large euro zone economies (see Figure 9).
Figure 9. Selected financial indicators for the non-financial corporate sector
| Gross operating surplus | Gross saving | |||||||
| % of GDP | % of corp. debt | % of GDP | % of corp. debt | |||||
| 2007 | 2012 | 2007 | 2012 | 2007 | 2012 | 2007 | 2012 | |
| France | 16.2 | 25.2 | 16.3 | 20.7 | 8.5 | 12.1 | 5.5 | 6.9 |
| Germany | 14.2 | 23.0 | 22.2 | 17.8 | 6.4 | 10.1 | 14.9 | 7.2 |
| Spain | 17.2 | 42.2 | 12.4 | 26.4 | 9.0 | 20.2 | 4.1 | 8.8 |
| Italy | 13.5 | 39.8 | 17.o | 21.5 | 6.1 | 17.4 | 11.4 | 8.7 |
Source: National accounts and Deutsche Bank.
Spain’s global trade position
Spain was the world’s 20th largest exporter of goods in 2012, almost the same as India, according to the World Trade Organisation. While the US, the UK, Germany, France and Italy have all lost global market export share to varying degrees over the last decade, mainly to China and other emerging countries, Spain’s share of world merchandise exports has remained virtually unchanged at around 1.6% (see Figure 10). Spain only lost 0.4 pp of its global share since its peak of 2.0% in 2004 compared with Germany’s 1.7 pp since 2004, the US’s 3.7 pp since 2000, France’s 1.8 pp since 2004 and Italy’s 1.1 pp since 2004.
Figure 10. Ranking by global market share of merchandise exports (%), 2009-12
| Country ranking (1) | 2012 | 2011 | 2010 | 2009 |
| 1. China | 11.2 | 10.4 | 10.4 | 10.1 |
| 2. US | 8.4 | 8.1 | 8.4 | 8.5 |
| 3.Germany | 8.3 | 8.1 | 8.3 | 9.0 |
| 6. France | 3.1 | 3.3 | 3.4 | 3.9 |
| 8. Italy | 2.7 | 2.9 | 2.9 | 3.2 |
| 11. UK | 2.6 | 2.6 | 2.7 | 2.8 |
| 20. Spain | 1.6 | 1.6 | 1.6 | 1.7 |
(1) In 2012.
Source: World Trade Organisation.
In exports of commercial services, Spain had the eighth largest global share in 2012, the same as Japan. The volume has remained more or less steady since 2008 at around $140 billion. The global share has dropped by 0.5 pp since 2009 to 3.2%, a slightly smaller decline than that of Germany and Italy (see Figure 11).
Figure 11. Ranking by global market share of exports of commercial services (%), 2009-12
| Country Ranking (1) | 2012 | 2011 | 2010 | 2009 |
| 1. US | 14.1 | 13.9 | 14.1 | 14.2 |
| 2. UK | 6.4 | 6.6 | 6.2 | 7.2 |
| 3. Germany | 5.9 | 6.1 | 6.3 | 6.5 |
| 4. France | 4.8 | 4.4 | 4.6 | 3.9 |
| 5. China | 4.4 | 3.9 | 3.8 | 4.2 |
| 8. Spain | 3.2 | 3.4 | 3.3 | 3.7 |
| 14. Italy | 2.4 | 2.6 | 2.6 | 3.0 |
(1) In 2012.
Source: World Trade Organisation.
Spain’s global share of imports has fallen by 0.5 pp since 2009 to 1.8% (see Figure 12), making it the 17th largest importer.
Figure 12. Ranking by global market share of imports of merchandise imports (%), 2009-12
| Country ranking (1) | 2012 | 2011 | 2010 | 2009 |
| 1. US | 12.6 | 12.3 | 12.8 | 12.7 |
| 2. China | 9.8 | 9.5 | 9.1 | 8.0 |
| 3. Germany | 6.3 | 6.8 | 6.9 | 7.4 |
| 5. UK | 3.7 | 3.5 | 3.6 | 3.8 |
| 6. France | 3.6 | 3.9 | 3.9 | 4.4 |
| 11. Italy | 2.6 | 3.0 | 3.1 | 3.2 |
| 17. Spain | 1.8 | 2.0 | 2.0 | 2.3 |
(1) In 2012.
Source: World Trade Organisation.
Imports of commercial services have remained virtually unchanged at around US$90 billion, while the global share dropped from 2.8% in 2009 to 2.2% in 2012 (see Figure 13).
Figure 13. Ranking by global market share of imports of commercial services (%), 2009-12
| Country ranking (1) | 2012 | 2011 | 2010 | 2009 |
| 1. US | 9.9 | 10.1 | 10.2 | 10.6 |
| 2. Germany | 6.9 | 7.3 | 7.3 | 8.2 |
| 3. China | 6.8 | 6.1 | 5.5 | 5.1 |
| 4. UK | 4.3 | 4.4 | 4.5 | 5.1 |
| 6. France | 4.2 | 3.6 | 3.6 | 4.0 |
| 13. Italy | 2.6 | 3.0 | 3.1 | 3.6 |
| 16. Spain | 2.2 | 2.4 | 2.4 | 2.8 |
(1) In 2012.
Source: World Trade Organisation.
Spain and the Transatlantic Trade and Investment Partnership (TTIP)
Spain’s export success, with sales abroad rising much faster than global export growth, has enhanced the government’s enthusiasm for a free trade and investment agreement between the EU and the US, known as the Transatlantic Trade and Investment Partnership (TTIP), which began to be negotiated last July.
Independent research suggests that the biggest trade deal in the world, once fully implemented, would benefit the EU more than the US as it would boost the former’s economy by €120 billion annually and the latter’s by €90 billion a year.
As well as cutting tariffs across all sectors, the EU and the US want to tackle barriers behind the customs border –such as differences in technical regulations, standards and approval procedures–. These often cost unnecessary time and money for companies who want to sell their products on both markets. For example, when a car or an aeroplane is approved as safe in the EU, it has to undergo a new approval procedure in the US even though the safety standards are similar.
The TTIP negotiations will also look at opening both markets for services, investment and public procurement.
The countries that would profit most are generally those that already have high relative trade volumes with the US such as the UK. Spain would also get above-average gains, according to a report published by Bertelsmann Stiftung,[5] even though both exports to the US and imports from it account for only around 4% of the total figures. Spain’s gain would be due to the fact that it could ‘replace relatively expensive European imports with imports from the US, which has a welfare increasing effect’.
The US market, the world’s most competitive, has long been difficult for Spanish companies to penetrate with any significant degree of success. While it would appear that Spain would benefit more on the import than on the export side from the TTIP, such a deal could motivate exporters to try harder. Spanish trade officials see enhanced possibilities for agri-food and capital goods exports and in public procurement where some Spanish companies, such as Ferrovial/Cintra, are already successful in winning contracts for transport infrastructure.
Prospects for exports: Europe’s ‘China’?
Spain’s export growth next year of more than 5% will be the strongest in the euro zone, according to the European Commission’s latest forecasts (see Figure 14).
Figure 14. Export Growth in the euro zone (%)
| 2014 (1) | 2013 | 2012 | |
| Spain | 5.2 | 4.5 | 2.1 |
| Germany | 4.6 | 0.3 | 3.2 |
| France | 4.3 | 1.4 | 2.4 |
| Euro zone | 4.2 | 1.3 | 2.5 |
| Italy | 2.6 | 0.1 | 2.0 |
(1) Forecasts.
Source: European Economist Forecast, Autumn 2013. European Commission.
There is still considerable scope for substantial growth, as evidenced by the still low level of per capita exports (see Figure 15) and what is called a branding problem that prevents exports from being better known. Price competitiveness has improved, but non-price-competitiveness factors –such as product design, distribution and customer service– continue to influence export performance. The latter probably explain why, according to a report by Morgan Stanley, Spain’s export outperformance is not yet appreciated widely enough in the marketplace.[6]
Figure 15. Merchandise exports per head (US$), 2012
| US$ | |
| Singapore | 76,981 |
| Netherlands | 39,281 |
| Germany | 17,200 |
| UK | 7,405 |
| Republic of Korea | 10,960 |
| Italy | 8,210 |
| Japan | 6,261 |
| Spain | 6,186 |
Source: World Trade Organisation figures for exports and World Bank for population.
According to the French bank Natixis, Spain has the potential to become the euro zone’s production centre of mid-market goods.[7] ‘Spain would then play more or less the same type of role for the euro zone as China has been playing for the world: a centre of production, hence the rise in China’s weight in global exports, but with a small share in sophisticated goods’.
Conclusion: Spanish exports have made tremendous strides in the past five years and are changing the pattern of economic growth away from domestic sources. The key question is whether this change is not just cyclical but also a structural improvement that is here to stay. The signs are promising. Domestic demand growth will remain subdued for a number of years and for the economy to grow it will have to continue to be export-led.
William Chislett
Associate researcher at the Elcano Royal Institute and author of ‘Spain: What Everyone Needs to Know’, published by Oxford University Press in September 2013
[1] The author would like to thank Sergio Pérez Sáiz (executive advisor to Jaime García-Legaz,, the Secretary of State for Trade), José Luis González Vallvé (Chairman of the Foreign Promotion Council of the Spanish Confederation of Business Organisations (CEOE) and former Director of the European Commission’s Representation in Spain) and Miguel Cardoso (BBVA’s chief economist for Spain) for their assistance.
[2] The changes are well explained in a BBVA report Economic Watch. Spain.
[3] See Tobias Buck (2013), ‘German exports “benefit Spanish economy”’, Financial Times, 19/XI/2013.
[4] Deutsche Bank Securities (2013), ‘Swapping growth models in Europe’, 18/VIII/2013.
[5] See Transatlantic Trade and Investment Partnership. Who benefits from a free trade deal?.
[6] Morgan Stanley (2013), ‘The New Spain’, 9/IX/2013.
[7] Natixis (2013), ‘Will Spain become Europe’s “China”?’, 22/X/2013.
