


Key messages
- This document analyses the evolution of Spain’s global presence, including both a geographical breakdown of its image abroad and the contribution made by each Autonomous Community.
- The article analyses the evolution of Spain’s global presence since 1990, disaggregating the geographical regions and countries that contribute to such presence. The authors also contrast these results with the objectives of Spain’s Foreign Action Strategy for 2025–2028.
- The results show the growth of Spain’s foreign profile since the 1990s, its interruption during the Great Recession and the recovery trend observed since the pandemic. It emerges that the EU and the rest of Europe account for the bulk of Spain’s presence. North America, and especially the United States, stands out as a strong and stable partner for Spain. Latin America is the third key region, given its strong cultural ties and sustained investment flows. Relations with Africa are also significant, with clear differences between the northern and southern parts of the continent. We also note Spain’s still limited profile in Asia. Despite the high concentration of its presence within the EU and the gradual alignment of foreign policy priorities, Spain’s global presence is today more diversified than at the start of the century.
- The present document also provides information on the Autonomous Communities. This is in order to provide deeper insight into the origins of Spain’s global presence. Although the origins of Spain’s external profile remain highly concentrated in Madrid and Catalonia, there is a growing decentralisation of productive and foreign trade capacities, as well as a marked diversification of regional productive structures.
Analysis
Globalisation is currently undergoing its greatest period of uncertainty since the 1990s. The narrative of multilateralism and free trade has been replaced by a logic of strategic security and protectionism, while the Global South demands a more active role in shaping the new world order. Moreover, there are growing doubts as to whether we are moving towards a new bipolarity embodied by the United States and China—with the European Union seeking to position itself as a counterbalance—or towards several regionally differentiated forms of multilateralism. In short, we are witnessing a transition from global interdependence to geopolitical rivalry, as already shown in the analysis of the 2025 edition of the Elcano Global Presence Index.
Recently, the Spanish Ministry of Foreign Affairs, European Union and Cooperation published its Foreign Action Strategy for 2025–2028. This document sets out both the thematic and geographical priorities of Spain’s external efforts as a whole, adapting them to the current geopolitical context and to how this affects Spain and its relations with the rest of the world. Spain defines itself primarily as an “EU member with an Atlantic profile”, while maintaining ti es with other regions—particularly the “Ibero-American Community of Nations”—and highlighting its privileged geographical position within the European context, which enables it to present itself as a “Euro-Atlantic and Mediterranean power acting as a bridge between Europe, Africa and Latin America”. Within this framework, it is useful to analyse both the trajectory of Spain’s external presence and its main international ties, in order to assess the extent to which they correspond to the priorities of the Foreign Action Strategy.
To this end, we draw on the Elcano Global Presence Index, a quantitative tool designed to measure globalisation across its various dimensions. On the basis of this, we seek first to analyse Spain’s evolution in the globalisation process between 1990 and 2024, as compared to similar countries. We then provide a geographical breakdown of Spain’s external profile—both in terms of volume and nature—to understand how it relates to other regions. This exercise, already conducted in 2020, is now updated to contextualise Spain’s relations with other powers in a post-pandemic environment of considerable international instability. Finally, we calculate the contribution of each Autonomous Community in order to assess how they contribute to Spain’s overall external profile.
1. Spain in the Global Presence Index
With a score of 319 points, Spain ranks 13th in the 2025 Global Presence Index, just behind Italy and ahead of Australia. It has held this position since 2011, which is relatively high compared with its rankings in terms of GDP and population—15th and 23rd, respectively. The evolution of the global presence ranking reflects the geopolitical changes that have taken place over recent decades and consequently shows the main European powers’ gradual loss of prowess in favour of Asian countries (Figure 1).
Spain’s transition to democracy occurred later than that of other European powers, and it therefore entered an international community that had already institutionalised various mechanisms of multilateral cooperation. Since the 1990s, Spain has undergone intense internationalisation, reflected in the growth of its global presence both in absolute terms and in its share of the world total (Figure 2). Between 1990 and 2010, Spain’s share of global presence rose from 1.8% to 2.7%, a significant increase in a context marked by the relative decline of European countries.
Figure 2. Evolution of Spain’s global presence, absolute value and global share
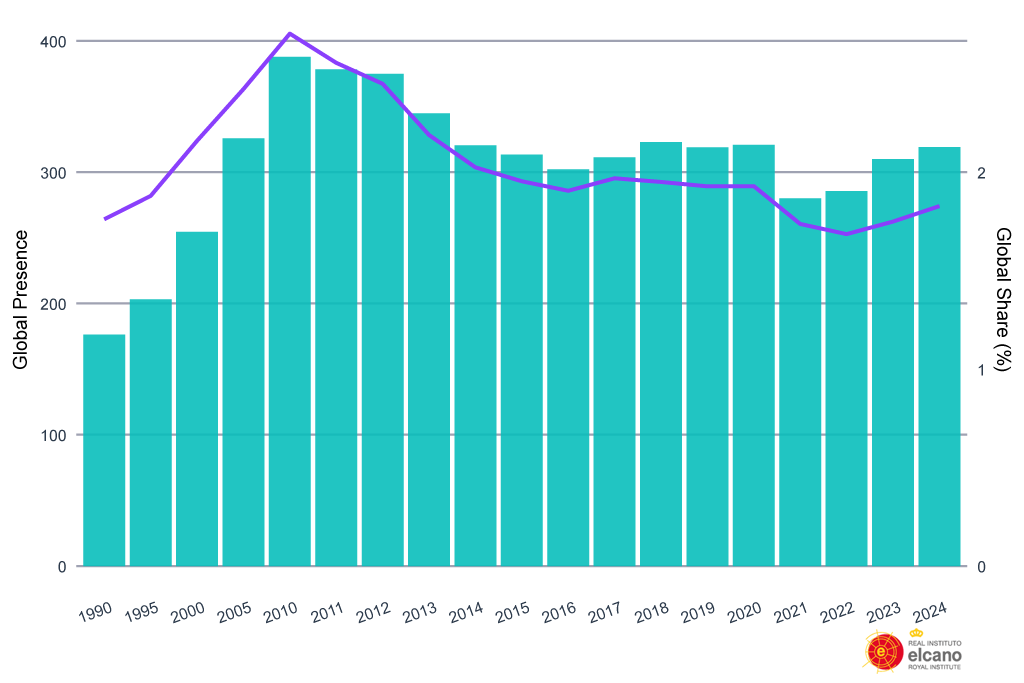
The Great Recession reversed this trend, reducing Spain’s global presence. This decline—albeit with some exceptions—was widespread among other EU member states and continued until the pandemic, bringing Spain’s share to its historical minimum. It is well known that the pandemic had a particularly strong impact on indicators related to the mobility of people (tourism, education, migration), which are central components of soft presence. Since then, Spain has once again shown growth in its external profile, in contrast to the rest of its European partners and even distinguishing it from the main emerging economies (Figures 3 and 4).
Thus, while the aggregate global presence of all countries has grown by 8.3% since the pandemic, Spain’s presence has increased by 14%. In contrast, neither Germany nor the United Kingdom have experienced such a rebound, and France and Italy have continued their downward trend since 2010 (Figure 3). Spain’s trajectory in recent years is also more favourable than that of other EU partners or countries with similar profiles (Figure 4), which, although less affected by the 2010 crises, have not recovered with the same intensity after the pandemic—such as Poland and Portugal—or have seen a slowdown in their growth, such as South Korea and Turkey. Even so, the level of presence recorded by Spain in 2024 remains slightly below that of 2020, at 82% of its 2010 value, before the impact of the crisis hit.
It goes without saying that states do not create their foreign presence in the same way, and thus they are affected differently by changes in the international context. In the case of Spain, its external profile was initially based on a strong expansion of its economic presence (Figure 5). This was a common feature, since globalisation is fundamentally—and initially—an economic process, accelerated by the process of European integration. This expansion occurred mainly through the growth, from the year 2000 onwards, of Spain’s stock of outward investment, as well as the strengthening of its service industry.
Figure 5. Evolution of Spain’s global presence 1990-2024, main indicators
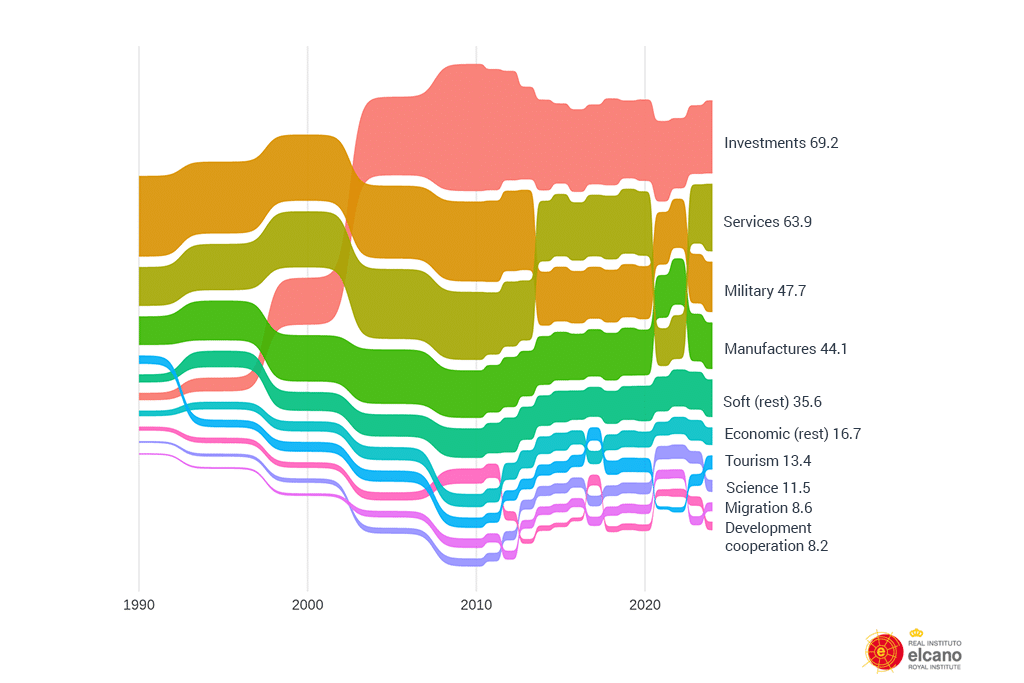
It comes as no surprise that the Spanish economy’s increasing dependence on the tertiary sector has been shaped by the structural weight of tourism, which accounts for its importance both as an indicator of the soft dimension and as a driver of service exports. However, since the pandemic there has been remarkable dynamism in non-tourism services, which may point to a process of diversification within Spain’s traditionally service-oriented profile. Within the soft presence dimension, the migration and science variables also stand out, though not technology, revealing a decoupling between these two indicators that helps explain the limited role of higher value-added manufacturing exports. As for development cooperation—a traditional feature of Spain’s external projection—it remains one of its main soft indicators, but it has lost prominence since 2010.
Meanwhile, the military dimension carries a relatively high weight, above the EU average and that of most European partners (only France and Italy rank higher). This is due to the importance of military equipment, which mainly includes assets for the external deployment of troops, an area in which Spain stands out as a naval power. The number of troops deployed abroad is comparatively small, reflecting Spain’s limited participation in direct conflicts. Overall, Spain’s military presence today is lower than it was in the 1990s, both in absolute terms and relative to its overall global presence, in line with a general worldwide trend during that period marked by the demilitarisation of international relations.
2. Geographical breakdown of Spain’s external projection
Current and previous Foreign Action Strategies highlight Spain’s privileged geographical position within the European context, presenting it as a “Euro-Atlantic and Mediterranean power acting as an intersection between Europe, Africa and Latin America”. While in general the main features remain the same—a combination of inherited historical traits and a gradual alignment with EU priorities—the current strategy places greater emphasis on the geographical dimension. This is evident in the adoption of a geo-economic perspective and in the concept of security, applied to external supply risks, coordination of sanctions and investment controls, as well as in a clearer articulation of the particularities of relations with different regions and within them.
In particular, the strategy proposes a vision of regional integration that goes beyond Spain’s relations with EU member states, giving greater prominence to its position as a bridge to other regions—specifically the “Ibero-American Community of Nations” within the transatlantic perspective—while also expressing the intention of strengthening ties with Africa beyond the Maghreb.
This section explores the global presence projected by Spain in each world region since 2005, with the aim of comparing these data with the objectives set out in the Foreign Action Strategy.
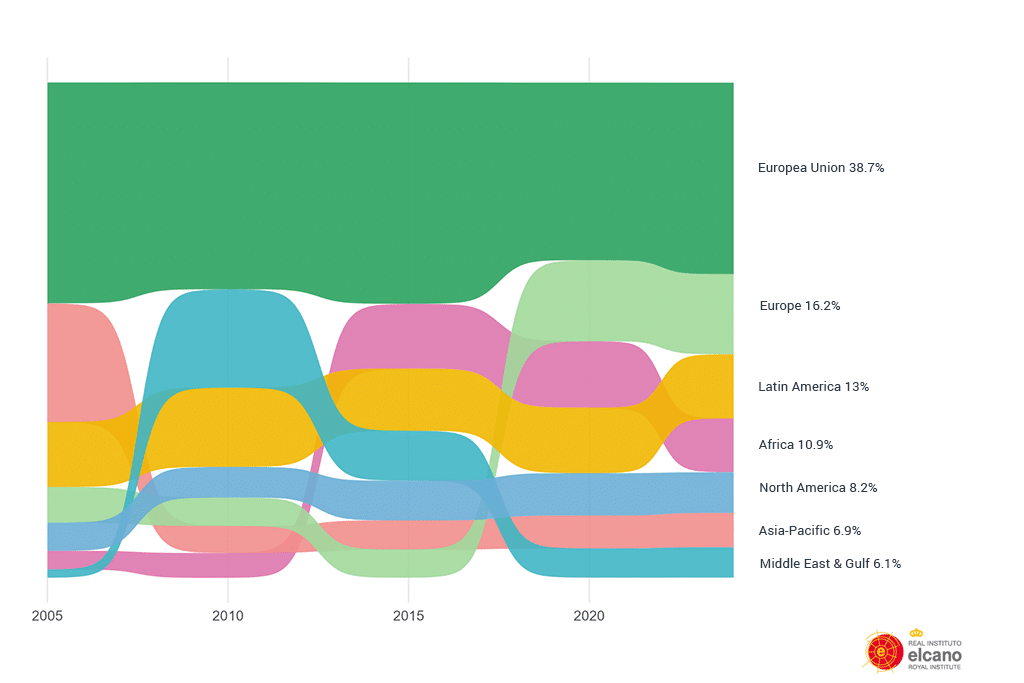
Figure 6. Geographical breakdown of Spain’s global presence, share of total (%)
2.1. Europe, beyond the European Union
The EU currently accounts for 38.7% of Spain’s global presence, confirming both the importance and the centripetal effect of the integration process. In other words, Spain projects itself primarily towards the EU and, secondly, towards the rest of Europe, which accounts for 16.2%. In total, the region accounts for 54.9% of Spain’s total global presence.
Within the EU, Spain’s presence is highly concentrated in a few countries. France accounts for 8.5%, Germany for 5.8%, and Italy and Portugal for 3.6% and 3.5% respectively. These four countries therefore make up 21.5% of Spain’s total global presence in 2024—a figure that has remained more or less stable over time.
Outside the common European space, the United Kingdom occupies a prominent place in Spain’s global presence, with 7.9% in 2024, second only to France. However, its share has declined since Brexit: in 2015, it was the leading destination of Spain’s external presence (10.4%), mainly due to stronger economic ties. Nonetheless, the UK remains highly relevant for Spain’s external relations and for those of the EU as a whole. It continues to be Spain’s second-largest destination for service exports and outward investment, as well as the main source of immigration and tourism to Spain.
Figure 7. Breakdown of Spain’s global presence by region and dimension, 2024
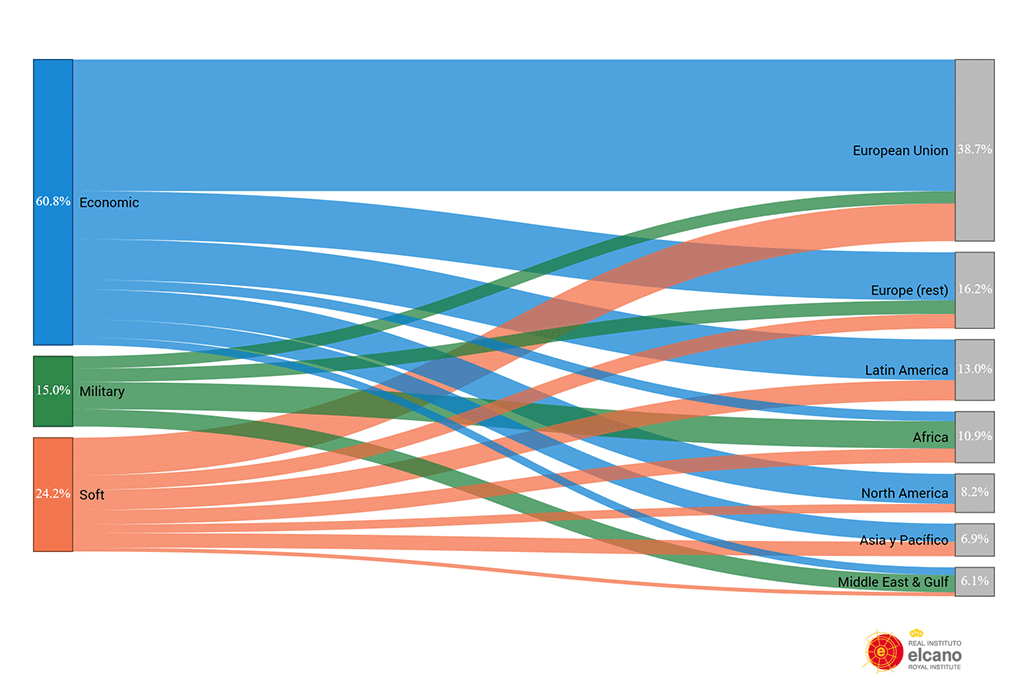
Spain’s profile in the EU is primarily economic: 28 of the 38.7 percentage points in the region correspond to exports of energy, primary goods, manufactures, services and outward investment. The regulatory framework naturally shapes the geographical distribution of economic relations—for instance, through the Common Agricultural Policy, the monetary union and the regional structuring of various production chains. At the same time, the EU is also the most important region for Spain’s soft presence—accounting for 8 percentage points—where it leads in indicators such as migration, tourism, sports, science and technology. These are simultaneously influenced by regulatory frameworks such as the European single market and the Schengen area.
Figure 8. Evolution of Spain’s presence in the EU as shown by the Elcano Global Presence Index
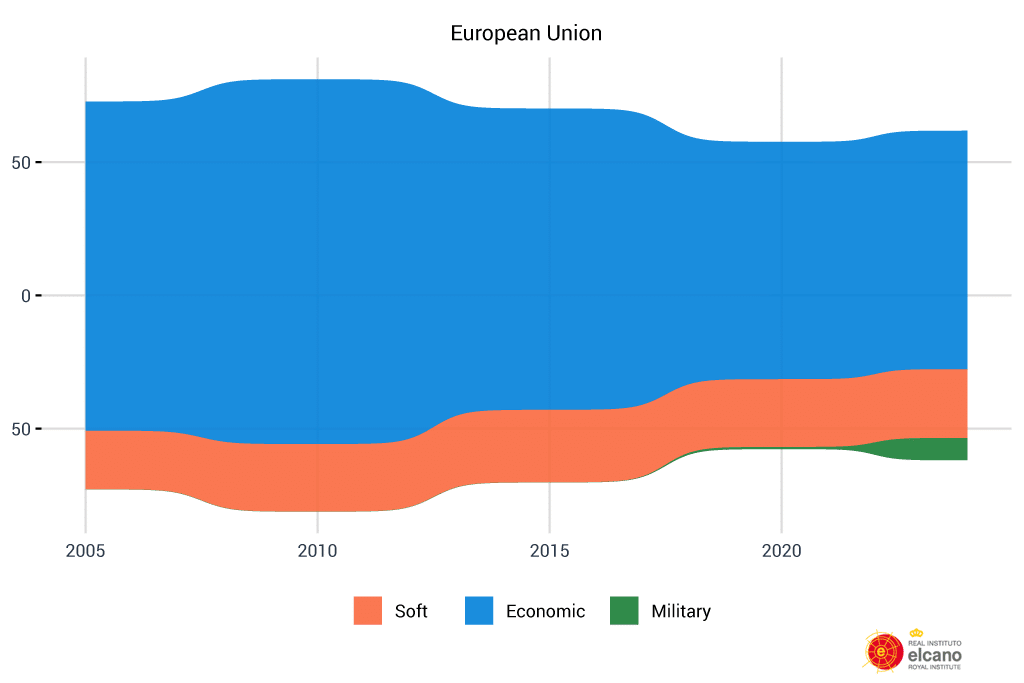
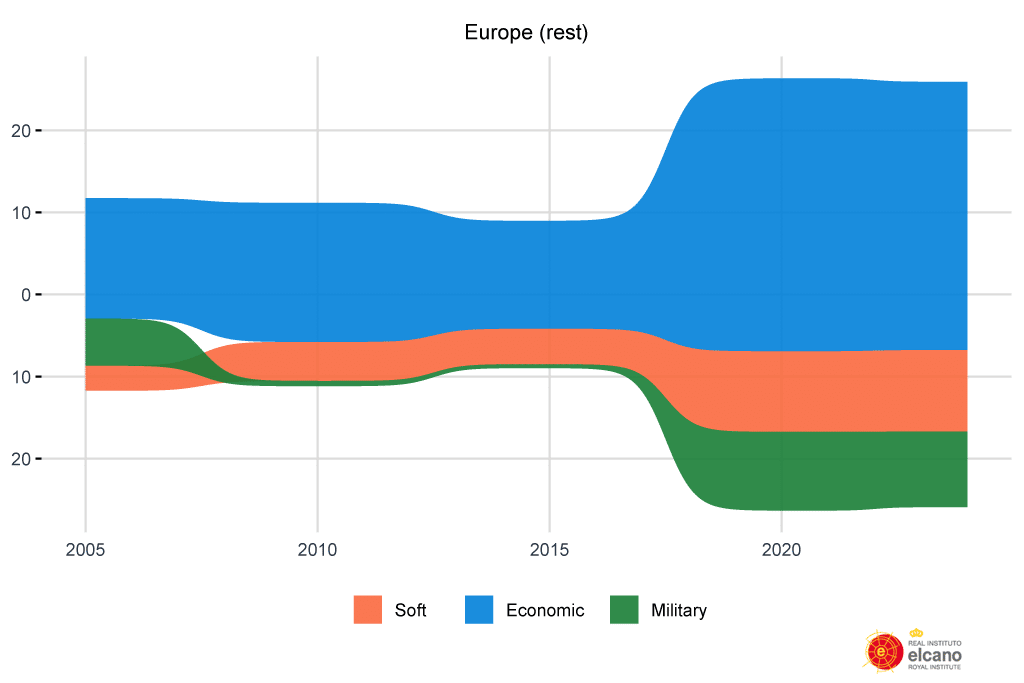
In recent years, a significant development has taken place: the emergence of military presence in other EU countries (Figure 8), specifically through the deployment of Spanish troops in Romania, Slovakia, Estonia and Latvia. This development has taken place in the context of the conflict with Russia, which has also led Spain to become more involved in international missions in the European region. Consequently, Spain’s military presence in the rest of Europe has increased as well, alongside a sudden rise in economic presence (Figure 9), linked to the United Kingdom’s withdrawal from the EU and the resulting change in the geographical composition of the regions concerned.
Figure 9. Evolution of Spain’s presence in the rest of Europe as shown by the Elcano Global Presence Index
2.2. Latin America
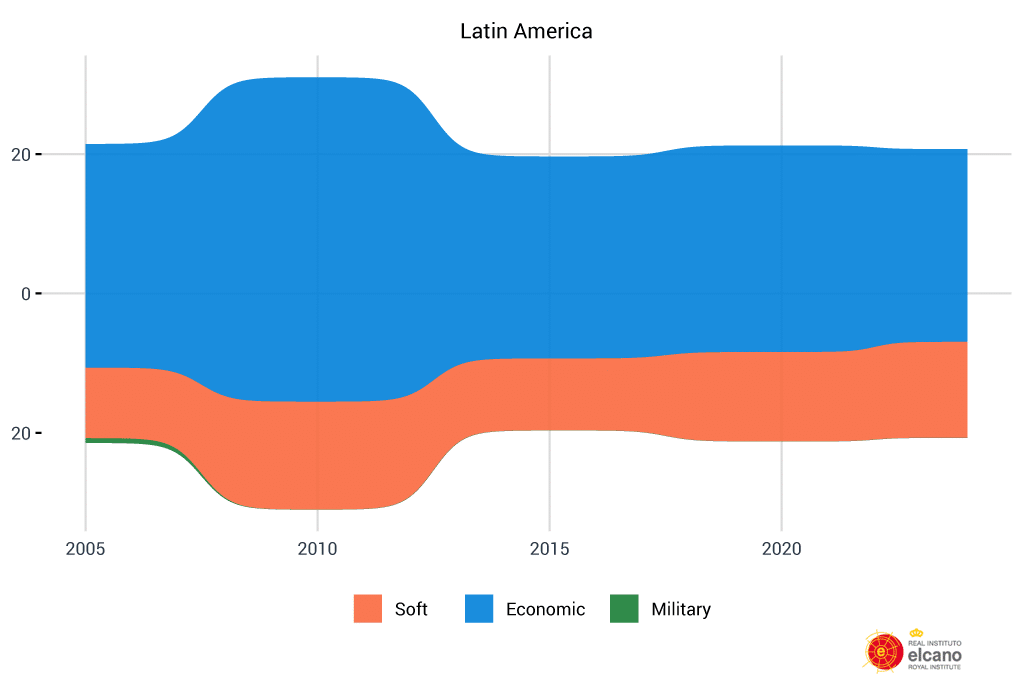
The Foreign Action Strategy identifies Latin America as “a constant feature in Spain’s identity and foreign action”, placing special importance on cultural and linguistic ties, which form the basis of soft relations, as well as on economic links, given the significance of Spanish investment in the region. Indeed, Latin America is Spain’s third most important region, accounting for 13 percentage points of its global presence in 2024 (Figure 10).
Latin America is well known as a key destination for Spanish foreign direct investment, with a share similar to that directed towards the EU—6.3% and 6.9% of Spain’s global presence in 2024, respectively. Spain’s soft presence in the region is also notable, given the cultural ties mentioned. In this dimension, Latin America ranks second after the EU, with Spain holding the top position in education—measured by the number of students enrolled in higher education—and in development cooperation, the second in migration and cultural exports, and showing a growth trend in other soft indicators such as tourism, science, and technology.
Within the region, Mexico stands out as the most significant country for Spain’s presence (3.1%), followed by Brazil (2.3%) and, at a greater distance, Argentina (1.1%). Yet together they account for only 6.5 of the 13 percentage points projected to the region, indicating that Spain’s presence in Latin America is geographically more diversified than in other regions.
Figure 10. Evolution of Spain’s presence in Latin America as shown by the Elcano Global Presence Index
2.3. Africa
After Latin America, Africa ranks as the fourth-largest recipient of Spain’s global presence, accounting for 10.9% in 2024 when the continent is taken as a whole. However, the differences between North Africa and Sub-Saharan Africa are significant, both in terms of volume and the nature of the relations. The Foreign Action Strategy addresses them separately, while noting that “Spain has endowed its vision of North Africa with a pan-African dimension.”
Although the strategy calls for deeper economic relations and the promotion of soft ties through, for example, “the promotion of Spanish in Africa”, the geostrategic importance of the continent in terms of security and governance makes the military dimension the most decisive in Spain’s relations with the region—5.8 of the 10.9 percentage points accounted for by Africa in 2024.
Figure 11. Evolution of Spain’s presence in Africa as shown by the Elcano Global Presence Index
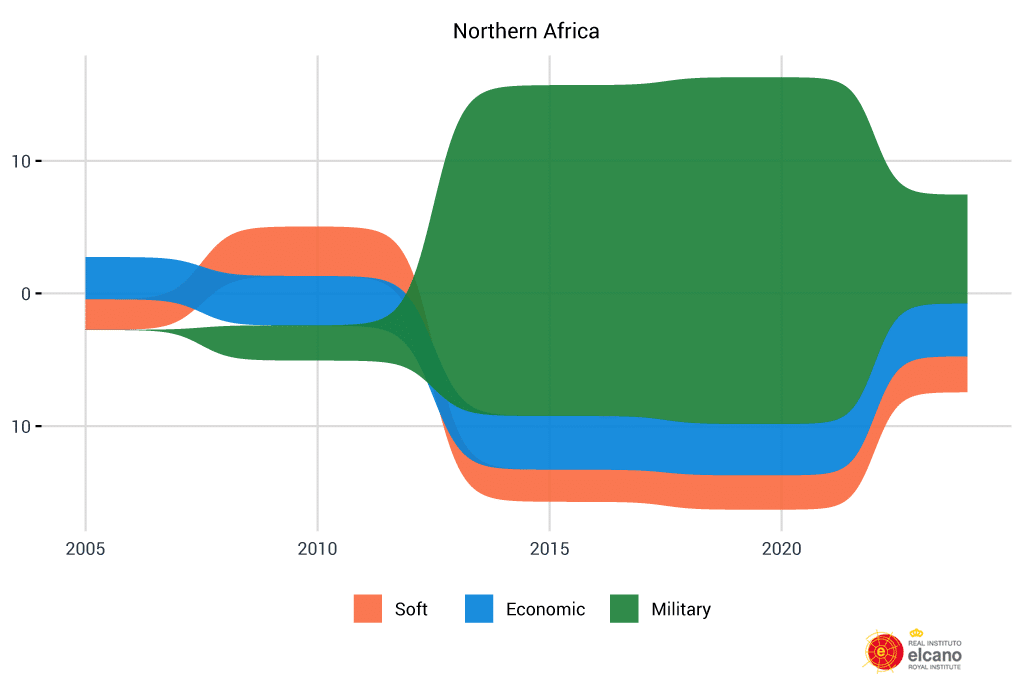
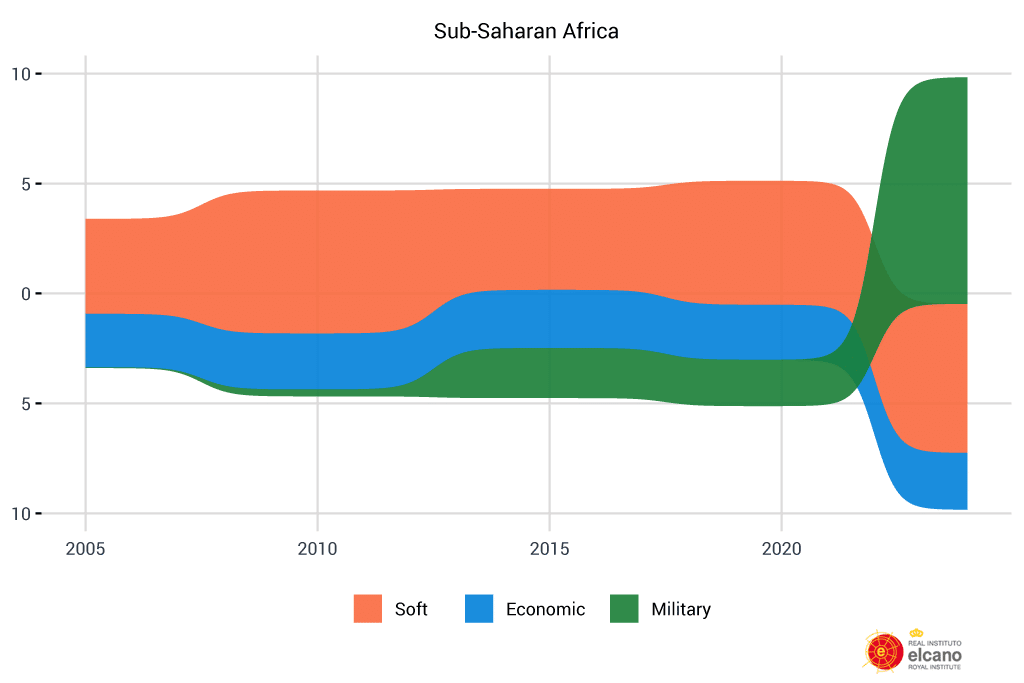
The military dimension shapes Spain’s projection both north and south of the Sahara (Figure 11) through its participation in NATO, EU and United Nations missions. In Sub-Saharan Africa, Spain maintains relatively small but geographically widespread deployments (Somalia, the Central African Republic, Mali, Djibouti, Gabon, Senegal and Mozambique). As for the Maghreb, however, Spanish military presence is entirely linked to the NATO mission launched in the Mediterranean in 2016.
The differences between North and Sub-Saharan Africa also extend to economic and soft relations. On the one hand, Spain’s trade in goods with Africa is greater than with Latin America—though not in services or outward investment—but is concentrated mainly in the northern part of the continent. By contrast, in relations with Sub-Saharan countries, the soft dimension— in particular migration and development cooperation—holds greater importance and weight.
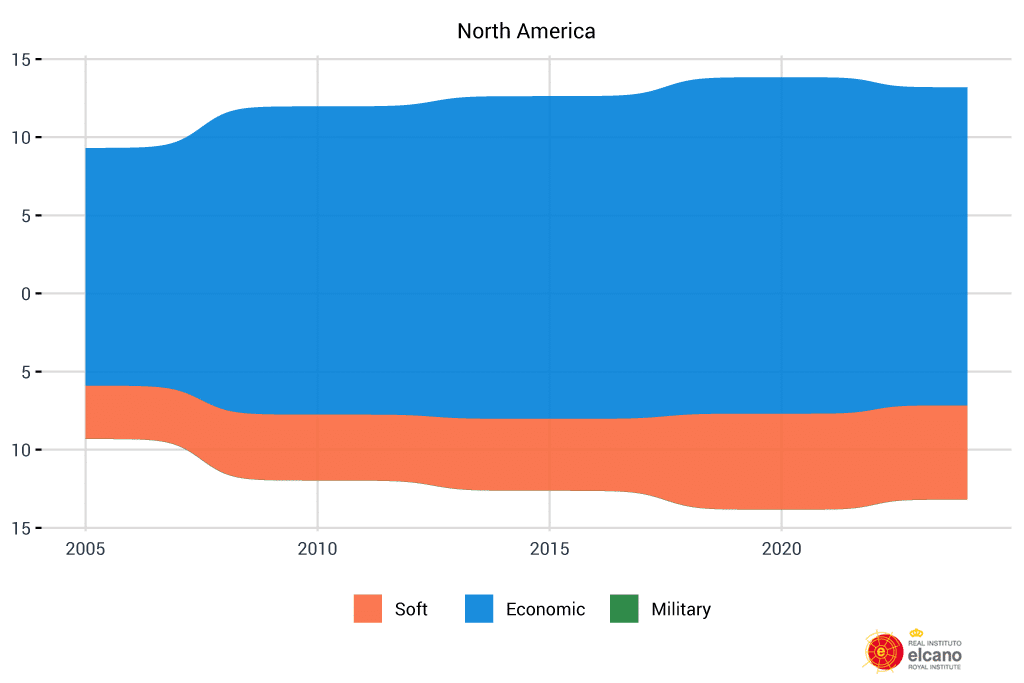
2.4. North America
The Foreign Action Strategy highlights relations with the United States and Canada due to their “status as NATO allies and strategic partners of the EU”. In terms of global presence, these ties have strengthened over time, accounting for 8.2% of Spain’s global presence in 2024, with economic links playing a more prominent role than soft ones—6.4 and 1.8 percentage points, respectively.
As was to be expected, Spain’s presence is heavily concentrated on the United States, which accounts for 7.5% of Spain’s total global presence, ranking just behind France and the United Kingdom. The United States stands out as the third-largest recipient of Spain’s economic presence—being the top-ranking destination of Spanish FDI—and the second of its soft presence, particularly in sports, science and technology.
Figure 12. Evolution of Spain’s presence in North America as shown by the Elcano Global Presence Index
2.5. Asia-Pacific
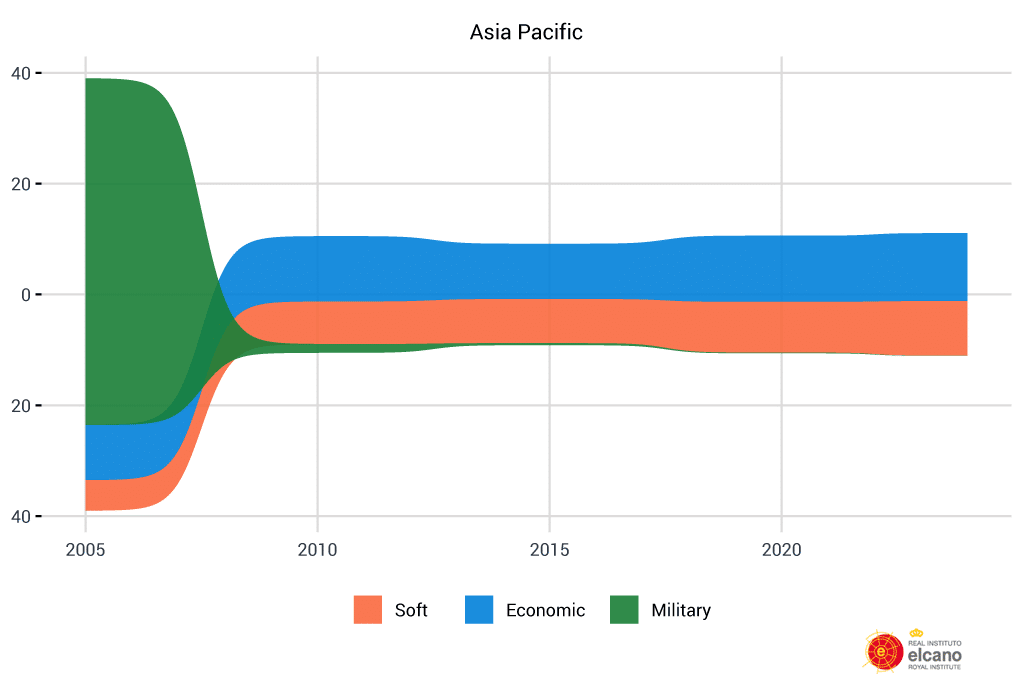
As far as Asia is concerned, the Strategy prioritises relations with Japan and South Korea but also emphasises the need to strengthen bilateral relations with China and to pay greater attention to India, as well as to other Southeast Asian countries such as Indonesia, the Philippines and Vietnam.
Despite Asia’s central role in global economic relations, Spain’s profile in the region remains particularly low—6.9% of its total presence in 2024—less than half of that in Latin America and lower than in Africa (Figure 7). However, certain specific indicators stand out, both economic—Asia ranks second among recipients of primary goods exports and the third for services—and soft indicators—ranking first for cultural exports and third for tourism, education and science. Spain’s military presence in the region, meanwhile, is linked to missions in Afghanistan in the early 2000s.
Classified by country, Spain’s presence is highly concentrated in China (2.2%), which comes well ahead of India (0.6%), Japan (0.6%) and South Korea (0.5%). This gap between measurable outcomes and stated bilateral priorities is striking, as is the limited weight of large, economically significant countries. This situation—despite China’s dominant share—reflects a geographically diversified, though still limited, profile among the other Asian countries.
Figure 13. Evolution of Spain’s presence in Asia and the Pacific as shown by the Elcano Global Presence Index
2.6. Middle East
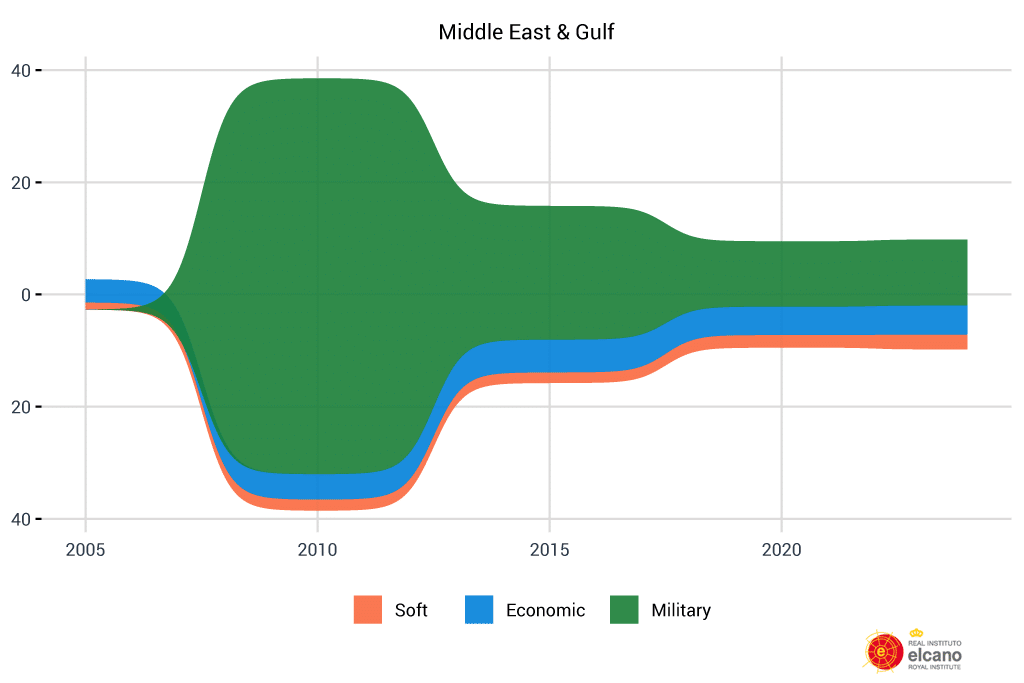
In the Middle East, Spain maintains its strongest military presence, making this dimension a key factor shaping its bilateral relations (Figure 14). Although a decline has been observed since 2010, Spain continues to participate in the EU mission in the Gulf of Aden and maintains troops in Lebanon and Iraq, binding itself to regional security dynamics. This focus on regional security is a consistent feature common to a range of foreign action documents. In recent years however other dimensions have gained importance, such as exports of manufactures and services, as well as technological cooperation.
Figure 14. Evolution of Spain’s presence in the Middle East and the Gulf, as shown by the Elcano Global Presence Index
3. Building Spain’s Global Presence
This section breaks down the results of Spain’s presence by Autonomous Communities, to understand how each Spanish region contributes to the country’s global presence. In terms of global presence, the highest contribution is made by the Community of Madrid, accounting for 28.7% in 2024, followed by Catalonia with 21.8%. These are followed by Andalusia, the Basque Country and the Valencian Community, which together make up the group of five regions with the highest contribution to Spain’s foreign profile (Figure 15).
Figure 15. Spain’s global presence by Autonomous Community, 2024, share of total
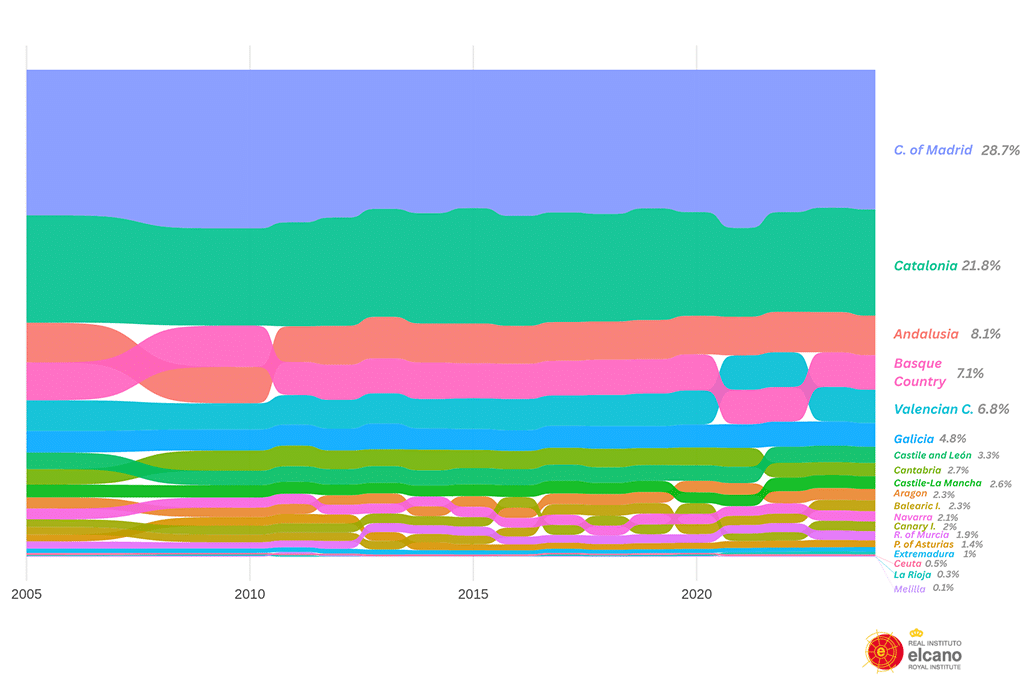
These results reveal a high territorial concentration in a limited number of Autonomous Communities, since more than half of Spain’s external profile is accounted for by Madrid and Catalonia alone, while the five leading regions comprise 70% of the total. However, since 2005 there has been a slight but persistent trend towards decentralisation: 20 years ago Madrid and Catalonia represented 52% of Spain’s presence and the five largest regions 74.2%, proportions somewhat higher than today.
There is also a strong correlation between a region’s demographic and economic size and its ability to project outward. Nonetheless, some regions are more externally oriented, as their contribution to Spain’s global presence exceeds their share of national GDP.
Figure 16 shows that Madrid, Catalonia, the Basque Country, Cantabria and Navarra carry greater weight in Spain’s external profile than in GDP, evidencing a higher degree of outward orientation than, for example, Andalusia, the Valencian Community, Galicia or Castile and Leon. This, in turn, is directly linked to the type of productive activity undertaken in each territory and to the so-called “headquarters effect”, referring to how the location of corporate headquarters alters a region’s contribution to economic indicators, even when production activities are not limited to that territory.
Thus, outward investment from Madrid is particularly significant, accounting for almost 11% of Spain’s total global presence (Figure 17). Other specific indicators also stand out in smaller regions, such as foreign investment from Cantabria—where several banking institutions are based—and the outward investment and manufacturing exports of Galicia, strongly linked to the textile and automotive industries.
Conclusions
Since the 1990s, Spain has followed one of the most dynamic internationalisation trajectories in Europe, with growth in its global presence exceeding that of most of its partners until the Great Recession. The crisis ushered in a decade of decline (2010–2020) during which, despite losing presence in absolute terms, Spain managed to maintain its position in the ranking. Even the severe impact of the pandemic on key indicators of Spain’s external profile—such as tourism and migration—did not alter that position. Since the pandemic, recovery has been significant, with a stronger performance relative to its European peers. All this has unfolded in parallel with the rise of Asian powers that have transformed the geography of globalisation. In this context, Spain has stood out for its ability to gain share during expansion phases and to sustain its position during periods of contraction in global presence.
The recently published Foreign Action Strategy (2025–2028) maintains continuity with the traditional principles of Spanish foreign policy—multilateralism, EU membership and the Atlantic link—but explicitly introduces economic security and places greater emphasis on the geographical dimension. This reflects a diagnosis of a geographically fragmented globalisation that could lead to greater regionalisation, concentrating Spain’s presence in areas that are closest to it.
The geographical breakdown of Spain’s global presence reveals the centripetal effect of the EU, which shapes the state’s external priorities and limits its autonomy in this regard. This regional importance increasingly extends to other European countries outside the integration process. However, Spain combines this European dependence with a progressively diversified pattern. Compared to two decades ago, its external presence now relies on a broader range of indicators and a more balanced geographical distribution.
Regarding the transatlantic link, the United States and the United Kingdom remain key destinations for Spain’s global presence, but so do other regions such as Africa and Latin America, each with distinct profiles. In Latin America, Spain maintains a leading role as an investor in sectors such as services, energy and construction, which by their nature generate limited spillover effects on trade structures. Cultural and linguistic affinity does not translate into higher exports of goods or cultural services in a region that has developed its own cultural industries. Asia has acquired growing importance in Spain’s cultural projection, yet despite an increase in its presence, links remain weak and heavily concentrated on China, highlighting the need for more diversified strategies towards what is now the consolidated epicentre of the world economy.
In Africa, Spain’s projection shows clear contrasts: while economic ties dominate in the North, the soft dimension—particularly migration and development cooperation—is more relevant in Sub-Saharan Africa. Beyond these differences, Spain’s presence on the continent is increasingly shaped by the military dimension. This pattern forms part of a broader global trend: the growing militarisation of international relations. Spain’s participation in international missions influences both the geographical configuration and the nature of its profile. Moreover, Spanish military presence has strengthened in Europe—within the EU and in neighbouring countries—amid the conflict with Russia, as well as in the Mediterranean and the Middle East. This centrality of the military dimension reduces Spain’s strategic autonomy and constrains the way it articulates its presence in other regions.
From the perspective of its domestic regions, Spain’s external projection relies on a small number of Autonomous Communities and specific indicators, particularly Madrid and Catalonia. However, as with the geographical distribution of its profile, there is a slight yet ongoing trend towards decentralisation in the territorial distribution of contributions, consistent with the diversification of Spain’s main aggregate indicators of global presence.
In a context of global fragmentation and competition between blocs, Spain can leverage its capacity for diversification and dialogue. Its simultaneous membership of the European, Atlantic, Mediterranean and Ibero-American spaces grants it a unique multi-dimensional and multi-geographical projection. The Foreign Action Strategy identifies this as Spain’s greatest asset: the capacity to act as a bridge between regional spheres in a world where strategic flexibility and the ability to move between different regional and thematic frameworks have become increasingly valuable strengths.
Methodological note
To calculate the geographical distribution of Spain’s global presence, both inward and outward, the authors have tried to maintain the general methodology of the Elcano Global Presence Indexv, disaggregating each variable “internally” in the case of the Autonomous Communities and “externally” in the case of geographical recipients. As far as possible, we have preserved the same criteria and sources used in the general methodology, although in some cases it has been necessary to apply specific adjustments, detailed below.
Autonomous Communities
To calculate the contribution of each Autonomous Community to Spain’s global presence, it has often been necessary to rely on domestic rather than international data sources. For example, instead of using United Nations trade data, we use DataComex, a data platform developed by the Ministry of Economy, Trade and Enterprise. This applies to many variables. The National Statistics Institute (INE) has also served as one of the main sources.
Beyond the heterogeneity of sources, some variables required different calculations from those used in the Index. The most significant case is the military dimension: it is impossible to break down the number of troops or amount of equipment by region, since this is a competence that depends entirely on the central government. Therefore, data from the State Tax Administration Agency on tax revenues at the regional level have been used. In addition, to avoid an excessive weight of communities that, for various reasons, concentrate a large share of tax collection (such as Madrid and Catalonia), their share of the national budget was corrected using population data.
Furthermore, the information variable was adapted to use the number of households with Internet access rather than bandwidth usage. Finally, the culture variable was calculated using a single source—film production by Autonomous Community—whereas in the general Index methodology, it is based on the sum of exports of cultural goods and services.
Geographical Destination
Here too, an exception has been made from the original Index methodology regarding the disaggregation of military presence. In the Elcano Global Presence Index, this dimension includes the variables Troops deployed abroad and Military equipment. In the case of military equipment, the original methodology considers the number of units available for troop deployment (aircraft carriers, cruisers, destroyers, frigates, nuclear submarines, amphibious ships, medium and heavy strategic aircraft and tanker aircraft). These units are counted for each country regardless of whether they are deployed abroad at a given moment.
For this exercise of “bilateralisation” however, we have considered only naval equipment actually deployed and the geographical area of deployment.
The Sports indicator was originally measured using a country’s Olympic medal performance, FIFA ranking points for the men’s and women’s national teams, and football club points. For its geographical disaggregation, we used the number of households with access to television as a proxy variable, assuming a higher potential presence in countries with greater access to television.
For the Information variable, two subindicators are considered: one related to a country’s presence in the media and another to its presence on the Internet. The first can be geographically disaggregated using the same database (Factiva), by counting mentions of Spain in the media of each country (excluding mentions in the EFE agency). However, for the Internet subindicator—measured by installed bandwidth in a country—it was necessary to use the number of households with Internet access as a proxy variable. Thus, we assumed that a higher number of people with Internet access translates into greater informational exposure to Spain.
For the Science variable, the distribution criterion used is the number of publications co-authored with authors of other nationalities, based on the assumption that greater scientific collaboration between international authors translates into greater bilateral presence.
Finally, to measure Spain’s Climate presence in other countries, we have applied the same measure used for the disaggregation of the United States’ presence: the Climate Vulnerability Index included in the University of Notre Dame’s GAIN-ND Index. Accordingly, we assume that a country’s vulnerability to climate change is directly related to the degree of projection other countries have in this indicator: the higher a country’s climate vulnerability, the greater the projection of others in that country.
Breakdown by Autonomous Community
| Variable | Indicator | Source |
| Economic Presence | ||
| Energy | Exports of energy products (SITC 333, 334, 343) by Autonomous Community. | DataComex (Ministry of Economy, Trade and Enterprise) |
| Primary Goods | Exports of primary goods, excluding oil (SITC 0 + 1 + 2 + 4 + 68 + 667 + 971) by Autonomous Community. | |
| Manufactures | Exports of manufactured goods (SITC 5 to 8 excluding 667 and 68) by Autonomous Community. | |
| Services | Exports of services by Autonomous Community. | INE |
| Investment | Stock of outward foreign direct investment by Autonomous Community, operations of non-ETVE companies. | DataInvex (Ministry of Economy, Trade and Enterprise) |
| Military Presence | ||
| Troops | Average population and tax revenue of the Spanish State by managing agent, by Autonomous Community. | INE and Regional Accounts Statistics of Spain, National Statistics Institute |
| Military Equipment | ||
| Soft Presence | ||
| Migration | Annual inflow of immigration from abroad by Autonomous Community of destination. | INE |
| Tourism | Travellers and overnight stays by Autonomous Community. | |
| Sports | Points of teams by Autonomous Community according to the IFFHS ranking, region of origin of Olympic medallists and of male and female national football team players. | FIFA and IOC |
| Culture | Film production companies with activity by Autonomous Community. | Institute of Cinematography and Audiovisual Arts, Ministry of Education, Culture and Sport |
| Information | Number of households with Internet access by Autonomous Community. | INE |
| News cables referring to Autonomous Communities from various international news agencies (Reuters, AP, AFP, Xinhua, ITAR-TASS, DPA, ANSA). | Factiva | |
| Technology | Outward-oriented patents: number of applications by Autonomous Community of residence of the first applicant. | SPTO |
| Science | Number of articles published in the fields of arts and humanities, social sciences, and natural sciences. | FECYT based on Incites data from the Web of Science (WOS) Core Collection |
| Education | International students received by Autonomous Community. | INE |
| Development Cooperation | Gross Official Development Assistance disbursements by Autonomous Community. | InfoAOD (MAEC) |
| Climate | Installed renewable energy capacity by Autonomous Community. | Red Eléctrica |
| Greenhouse gas emissions by Autonomous Community. | Ministry for the Ecological Transition and the Demographic Challenge | |
Breakdown of global presence of Spain by geographic destination
| Variable | Indicator | Source |
| Economic Presence | ||
| Energy | Exports of energy products (SITC 3) by trading partners. | UNCTAD |
| Primary Goods | Exports of primary goods (SITC 0 + 1 + 2 + 4 + 68 + 667 + 971) by trading partners. | |
| Manufactures | Exports of manufactured goods (SITC 5 + 6 + 7 + 8, excluding 667 and 68) by trading partners. | |
| Services | Exports of manufactured goods (SITC 5 + 6 + 7 + 8, excluding 667 and 68) by trading partners y. | OECD and WTO |
| Investment | Stock of outward foreign direct investment (non-ETVE operations) by destination country. | DataInvex (Ministry of Economy, Trade and Enterprise) |
| Military Presence | ||
| Troops | Spanish troops deployed abroad. | IISS |
| Military Equipment | Naval equipment deployed abroad. | |
| Soft Presence | ||
| Migration | Foreign population by nationality and sex. | INE |
| Tourism | Arrivals at tourist accommodation by country of origin. | Eurostat |
| Sports | Number of television users in each country. | ITU |
| Culture | Exports of cultural goods by trading partner. | Eurostat |
| Exports of cultural services by trading partner. | UNCTAD | |
| Information | Number of Internet users. | ITU |
| Mentions of Spain in national press (excluding EFE Agency). | Factiva | |
| Technology | Revenues received from intellectual property by country of origin. | UNCTAD |
| Number of Spanish patent applications oriented abroad by country of registration. | WIPO | |
| Science | Number of articles, notes, and reviews published by a Spanish author with a foreign co-author, by co-author’s country of affiliation. | FECYT, Incites data from WOS |
| Education | Number of foreign students in tertiary education by country of origin. | Eurostat |
| Development Cooperation | Official Development Assistance flows by destination country. | InfoAOD (Ministry of Foreign Affairs, European Union and Cooperation) |
| Climate | Notre Dame Global Adaptation Initiative (ND-GAIN) Climate Vulnerability Index. | University of Notre Dame |