


Theme: The third edition of the Elcano Global Presence Index (IEPG) is out. This year, we have also calculated the EU’s global presence –as if it were a single country– and estimated the presence of member States in the European sphere.
Summary: The catching-up process of several emerging economies and the crisis in the United States and Europe have also had implications for their global presence: the IEPG shows that Western countries keep on losing positions in the global scene. However, if the European Union were to count as a single country, it would top the world in terms of global presence. The economic divergence and concentration that characterise the European Union are also apparent in terms of intra-European presence: in general terms, the old members have more ‘presence gains’ than the newcomers. Lastly, the IEPG shows that the weaknesses of Spanish external insertion call for a new foreign action strategy.
Analysis: In the last few years and, particularly, since the advent of the current crisis, studies on the swing in economic activity and world power from the Atlantic to the Pacific axis have proliferated.[1] Some analyses have debated the nature of this change of epicentre. Is it limited to the economic sphere or are there other political elements at play, such as the military or development cooperation?[2] Moreover, the shift affects the relative global presence of the old Western countries, which has become increasingly undermined. This relates to the question of whether world power is becoming multipolar –with a handful of old and new influential states– or is heading towards a 0-order in which virtually no-one –no state and no multilateral organisation– is ready or willing to rule the system (Bremmer & Gordon 2011).[3]
And this question leads to another important issue, which is the political future of the European Union.[4]Besides its impact on the stability of the common currency area, the lack of depth of economic and political integration may be having consequences on the global presence and influence of the European Union as a whole. The other side of the coin is that the European integration process, as we know it, may have heightened the economic differences between the member states.[5]In terms of intra-European presence, this might mean that the ‘presence gains’ of integration might not be evenly distributed among the member states.
The Elcano Global Presence Index (IEPG after its name in Spanish) aims to contribute to these debates by measuring global presence. We divide global presence into three dimensions: economic presence –energy, primary goods, manufactures, services, investments–, military presence –troops, military equipment– and soft presence –migrations, tourism, sports, culture, information, technology, science, education and development cooperation–. Therefore, although related, the IEPG is not a measure of global power or influence. It rather tries to show comprehensively the effective, real and objective –not perceived– presence of countries outside their borders in a wide variety of fields (Olivié & Gracia, 2013).[6]
This policy brief goes through some of the main results of the third edition of the IEPG. The 2012 IEPG shows that the ‘de-Westernisation’ process under way is becoming deeper. It also debates what the global status of the European Union would be if it were to become the ‘United States of Europe’ and how the integration process has affected its member states in terms of intra-European presence. Finally, we discuss these results for the particular case of Spain.
Shifting South and East
One way to see the IEPG ranking (Table 1) is that the 20 countries that are currently heading the list are more or less the same since the early 90s. In fact, only two countries have left the list –Austria and Mexico– while two others have come in –Brazil and Singapore–. Seven of the top 20 countries that currently comprise the ranking are developing countries and emerging economies.
However, there have been significant shifts within the top 20. China now ranks 4th and Brazil is 19th. Two emerging Asian countries, China and Singapore, have climbed up nine places. South Korea has risen five steps and India and Brazil four each. Meanwhile, Russia has lost four positions –although it should be borne in mind that the 1990 IEPG is calculated for the Soviet Union–. Belgium has dropped four also. Italy, Switzerland and Sweden have gone down three. While the United States remains the country with the highest global presence, emerging economies –particularly Asian countries– have replaced several European countries.
Moreover, this ‘de-Westernisation’ process seems to have accelerated with the economic crisis. Note that Belgium, France and Sweden have each lost one position between 2011 and 2012.
This does not mean that all European countries are being equally affected by either de-westernisation or the economic crisis. Germany and the UK have gained one and two positions respectively over the past couple of decades.
Table 1. IEPG ranking (20 top positions)
| 2012 | 2011 | 1990 | ||||
| Position | Country | IEPG | Position | D | Position | D |
| 1 | United States | 1.012.3 | 1 | = | 1 | = |
| 2 | Germany | 390.7 | 2 | = | 3 | +1 |
| 3 | United Kingdom | 347.5 | 3 | = | 5 | +2 |
| 4 | China | 308.4 | 5 | +1 | 13 | +9 |
| 5 | France | 297.5 | 4 | -1 | 4 | -1 |
| 6 | Russia | 243.7 | 7 | +1 | 2 | -4 |
| 7 | Japan | 237.4 | 6 | -1 | 6 | -1 |
| 8 | Netherlands | 218.3 | 8 | = | 9 | +1 |
| 9 | Canada | 194.1 | 9 | = | 8 | -1 |
| 10 | Italy | 171.5 | 10 | = | 7 | -3 |
| 11 | Spain | 162.8 | 11 | = | 10 | -1 |
| 12 | Saudi Arabia | 152.1 | 15 | +3 | 12 | = |
| 13 | Australia | 149.4 | 12 | -1 | 14 | +1 |
| 14 | South Korea | 146.1 | 13 | -1 | 19 | +5 |
| 15 | Belgium | 132.6 | 14 | -1 | 11 | -4 |
| 16 | India | 108.0 | 17 | +1 | 20 | +4 |
| 17 | Singapore | 106.3 | 16 | +1 | 25 | +9 |
| 18 | Switzerland | 97.0 | 18 | = | 15 | -3 |
| 19 | Brazil | 94.2 | 20 | +1 | 23 | +4 |
| 20 | Sweden | 87.7 | 19 | -1 | 17 | -3 |
Towards a 0-order?
The United States retains its position as the country with the leading global presence, while China has seen an increase in its external projection. Does this means that we are heading towards a new bipolarity led by the United States and China? For now, and as far as global presence and the IEPG calculation are concerned, the answer is no.
The share of global presence of the United States has steadily decreased since the end of the Cold War: it has dropped from 24.1% in 1990 to 16.6% in 2012. Meanwhile, the share of China has increased dramatically during that same period, jumping from only 1.4% of total global presence to 5.1%. However, China’s growth in global presence has not been large enough to compensate the decline of the United States. This means that the sum of the shares of the two countries has decreased from 25.5% in 1990 to 21.7%.
As a result, the foreign projection of countries in a variety of areas is probably being spread amongst a larger number of nations. To test this idea, we apply the Herfindahl-Hirschman Index (HHI) –traditionally used for assessing the degree of competition or concentration between companies–[7]. It ranges from 0 –total ‘competition’ in global presence between countries– to 10,000 –a total monopoly of world global presence by a single country–. The HHI applied to the IEPG has decreased from 934 in 1990 to 524 in 2012 (Table 2). Hence, global presence is becoming increasingly dispersed amongst a larger number of countries (Graph 1).
Table 2. Herfindahl-Hirschman Index (HHI) applied to the IEPG
| 1990 | 1995 | 2000 | 2005 | 2010 | 2011 | 2012 |
| 934 | 803 | 803 | 653 | 599 | 557 | 524 |
It could be said that the international influence of states is at least partly determined by the global presence of the countries they represent. In that case, these results could add something to the parallel debate on whether power and influence are shifting to a new pole –or set of poles–, or if, to the contrary, the global scene is heading towards a certain international anarchy. In this respect, the results might be more aligned with the 0-order thesis posed by Bremmer & Gordon (2011).
Graph 1. Global presence dispersion over the past two decades
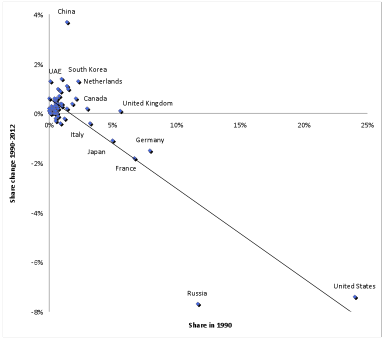
Another interesting feature of this trend towards a greater dispersion is that it has a changing pattern: in 1990-2005, global presence was diversified mainly as a result of the dispersal of economic presence. However, between 2005 and 2012, it is mostly soft presence that leads the process. There can be several explanations for this. For instance, it could be due to the Great Recession that might be hitting the economic variables harder than the soft ones. However, it might also be the result of the changing nature of the internationalisation of countries: the emerging countries might have started their processes of external insertion in the 90s through the economy but are now turning to softer ways of being present in the world.
What if there were a United States of Europe?
What if the European Union to make a qualitative leap forward towards a political union and therefore became a single country? What would its global presence be like? The European Union would be the country with the highest global presence (1,088.3 in 2012), although only just ahead of the United States of America (1,012.3). Actually, the two countries –one of them hypothetical– would have a combined share of 43.5% of total global presence. China would rank 3rd, with a presence approximately a third of that of the European Union and the United States. In general terms, there would, obviously, be a scaling-up of all emerging countries in the ranking. Among the top 20, 13 would be developing or emerging (Table 3).
Table 3. IEPG ranking (top 20 positions) including the European Union
| 2012 | 2011 | 2005 | ||||
| Position | Country | IEPG | Position | D | Position | D |
| 1 | European Union | 1.088.3 | 1 | = | 2 | +1 |
| 2 | United States | 1.012.3 | 2 | = | 1 | -1 |
| 3 | China | 308.4 | 3 | = | 5 | +2 |
| 4 | Russia | 243.7 | 5 | +1 | 4 | = |
| 5 | Japan | 237.4 | 4 | -1 | 3 | -2 |
| 6 | Canada | 194.1 | 6 | = | 6 | = |
| 7 | Saudi Arabia | 152.1 | 9 | +2 | 8 | +1 |
| 8 | Australia | 149.4 | 7 | -1 | 7 | -1 |
| 9 | South Korea | 146.1 | 8 | -1 | 9 | = |
| 10 | India | 108.0 | 10 | = | 14 | +4 |
| 11 | Singapore | 106.3 | 11 | = | 13 | +2 |
| 12 | Switzerland | 97.0 | 12 | = | 10 | -2 |
| 13 | Brazil | 94.2 | 13 | = | 17 | +4 |
| 14 | United Arab Emirates | 82.3 | 15 | -1 | 15 | +1 |
| 15 | Norway | 80.2 | 14 | +1 | 12 | -3 |
| 16 | Mexico | 76.2 | 16 | = | 11 | -5 |
| 17 | Malaysia | 71.4 | 17 | = | 18 | +1 |
| 18 | Indonesia | 63.1 | 19 | +1 | 21 | +3 |
| 19 | Turkey | 59.2 | 18 | -1 | 16 | -3 |
| 20 | Thailand | 58.3 | 20 | = | 19 | -1 |
The European Union would have held the 1stposition since 2010, largely due to the in its economic presence. This would be the result of dynamic services exports and outward investments. Exports of manufactures and primary goods have also surged, raising the contribution of the economic dimension to the European Union’s global presence from 32% in 2005to 44.5% in 2012.
However, the European Union’s presence in the world is mostly soft. This accounts for 52% of the total IEPG. It is worth highlighting its role in sports, development cooperation, technology, science and tourism, and, to a lesser extent, migration, culture and education.
The European military presence has decreased both in absolute and relative terms, from 6% to 3.5% of its total presence between 2005 and 2012.
However, and despite its significant presence relative to other countries, the current crisis has prompted a slowdown in the IEPG-EU’s growth in several variables. In 2011, the economic presence records a slower growth, and in the case of the soft variables the trend dates back to 2010. Development cooperation drops sharply in 2012, a trend that is likely to continue and will have strong implications for Europe’s global presence.
What happens inside Europe in terms of presence?
It is also possible to analyse the relative presence of member states within the European Union. Just as the global presence in all fields can be estimated for the UK, Germany, Cyprus and Spain, several statistical sources allow the calculation of the presence of these countries in the European sphere. We have called this index the Elcano European Presence Index –IEPE, after its initials in Spanish– (Olivié & Gracia, 2013).
According to the IEPE, Germany tops the list of member states in intra-European presence (Table 4). It is followed by the UK, France and the Netherlands and all four countries have maintained these positions since 2005, the first year for which the IEPE is calculated. Spain holds the 5th position and has therefore climbed two places in the last eight years.[8]All countries in positions 19 to 27 held the same places in 2005 and 2012, as did Italy, Poland, Ireland and the Czech Republic, in addition to the top four. Hence, unlike the IEPG and although with some exceptions, there is no great variation in the presence of member states within the European space.
Table 4. IEPE ranking
| 2012 | 2005 | |||
| Position | Country | IEPE | Position | D |
| 1 | Germany | 706.7 | 1 | = |
| 2 | United Kingdom | 654.7 | 2 | = |
| 3 | France | 519.6 | 3 | = |
| 4 | Netherlands | 442.2 | 4 | = |
| 5 | Spain | 302.9 | 7 | +2 |
| 6 | Italy | 279.9 | 6 | = |
| 7 | Belgium | 272.2 | 5 | -2 |
| 8 | Luxembourg | 157.3 | 17 | +9 |
| 9 | Sweden | 151.8 | 8 | -1 |
| 10 | Austria | 135.9 | 9 | -1 |
| 11 | Ireland | 123.8 | 11 | = |
| 12 | Denmark | 108.4 | 10 | -2 |
| 13 | Poland | 100.8 | 13 | = |
| 14 | Check Republic | 82.1 | 14 | = |
| 15 | Hungary | 79.9 | 12 | -3 |
| 16 | Portugal | 61.6 | 18 | +2 |
| 17 | Finland | 59.6 | 15 | -2 |
| 18 | Greece | 50.7 | 16 | -2 |
| 19 | Romania | 35.7 | 19 | = |
| 20 | Slovakia | 35.6 | 20 | = |
| 21 | Bulgaria | 22.3 | 21 | = |
| 22 | Lithuania | 20.5 | 22 | = |
| 23 | Slovenia | 20.4 | 23 | = |
| 24 | Estonia | 14.6 | 24 | = |
| 25 | Latvia | 11.3 | 25 | = |
| 26 | Cyprus | 10.1 | 26 | = |
| 27 | Malta | 5.5 | 27 | = |
In other words, ‘presence gains’ might be related to the date of accession: the sooner countries joined the European Union, the more presence they gained within the European space, and this applies particularly to Germany. However, two countries seem to escape the trend: the UK and Spain have benefited more than proportionally from joining the European Union in terms of European presence (Table 5).
Table 5. EU accession and ‘presence gains’
| EU Accession | Euro | Country | IEPE 2012 | 2005-12 |
| 1958 | Yes | Germany | 706.7 | 187.9 |
| 1973 | United Kingdom | 654.7 | 262.3 | |
| 1958 | Yes | France | 519.6 | 170.7 |
| 1958 | Yes | Netherlands | 442.2 | 170.7 |
| 1986 | Yes | Spain | 302.9 | 117.4 |
| 1958 | Yes | Italy | 279.9 | 77.8 |
| 1958 | Yes | Belgium | 272.2 | 41.0 |
| 1958 | Yes | Luxembourg | 157.3 | 123.8 |
| 1995 | Sweden | 151.8 | 57.6 | |
| 1995 | Yes | Austria | 135.9 | 47.2 |
| 1973 | Yes | Ireland | 123.8 | 59.6 |
| 1973 | Denmark | 108.4 | 36.3 | |
| 2004 | Poland | 100.8 | 48.4 | |
| 2004 | Check Republic | 82.1 | 38.8 | |
| 2004 | Hungary | 79.9 | 17.1 | |
| 1986 | Yes | Portugal | 61.6 | 29.3 |
| 1995 | Yes | Finland | 59.6 | 21.6 |
| 1981 | Yes | Greece | 50.7 | 13.0 |
| 2007 | Romania | 35.7 | 5.9 | |
| 2004 | Yes | Slovakia | 35.6 | 17.2 |
| 2007 | Bulgaria | 22.3 | 5.0 | |
| 2004 | Lithuania | 20.5 | 8.7 | |
| 2004 | Yes | Slovenia | 20.4 | 10.1 |
| 2004 | Yes | Estonia | 14.6 | 5.9 |
| 2004 | Latvia | 11.3 | 3.9 | |
| 2004 | Yes | Cyprus | 10.1 | 2.9 |
| 2004 | Yes | Malta | 5.5 | 2.3 |
Notes:![]()
Is Spain’s external insertion not sufficiently strategic?
It is important not to misunderstand either the IEPG value of a specific country or how it evolves. That a country moves up does not necessarily mean that it is better off. For instance, global presence can rise as a result of the participation in a military conflict that is not being backed by the international community and this could undermine its international image and/or influence. Moreover, although they might be related, a greater presence does not automatically mean more power or influence. A country can hold a leading position in commodity exports and, at the same time, have a very low voting share in regional and international organisations.
In short, both the IEPG and the IEPE aim to show both the volume and the nature –flaws and strengths– of the global and European presence of countries. In Spain’s case, the IEPG might be revealing an external insertion that is more indiscriminate and less strategic.
Spain’s foreign policy in the last decades has been highly proactive in re-inserting the country in the international community, after the transition to democracy in the 70s. This has resulted in a dramatic increase in Spain’s IEPG in the 1990-2012 period. It has almost trebled over the period –rising from 41.8 to 162.8– whereas the United States’ and Portugal’s external presences during that same period have increased by 112% and 232%, respectively. Spanish foreign policy in the last decades has clearly been a success in the sense that it has achieved its main goal: getting the country back to the world arena. However, on the other hand, the nature of the presence might show a relatively non-strategic type of insertion, with signs of an unsustainable and imbalanced type of global presence.
Both at the global and the European level, Spain’s presence rests on its soft dimension. This could be an asset. However, the best performing variables are symptomatic of a productive model and an external insertion of low added value, conferring vulnerability to the whole country. For instance, in the economic field, internationalisation is the result of companies’ outward investments, rather than exports. As for the soft dimension, it depends to a large extent on tourism and sports, rather than on more strategic assets such as education and technology.
The current economic crisis has also made itself felt on the global presence variables: the Spanish IEPG, which grew at an annual average of 11% between 2000 and 2010 has slowed down to 6.7% between 2010-2012. Obviously, some variables have been hit harder than others. This is the case of science, development cooperation and investments (Table 6).
Table 6. Spain’s IEPG
| 1990 | 1995 | 2000 | 2005 | 2010 | 2011 | 2012 | |
| Economic presence | 11.4 | 18.1 | 25.2 | 46.5 | 63.5 | 67.7 | 77.8 |
| % IEPG | 27.4 | 34.4 | 37.0 | 44.1 | 44.1 | 44.2 | 47.5 |
| Energy | 1.1 | 0.4 | 1.5 | 3.1 | 3.7 | 4.6 | 4.7 |
| Primary goods | 2.4 | 5.1 | 5.6 | 9.9 | 12.9 | 14.4 | 18.9 |
| Manufactures | 2.8 | 4.6 | 5.8 | 9.7 | 10.8 | 11.7 | 14.4 |
| Services | 4.9 | 7.1 | 9.2 | 16.6 | 21.4 | 21.6 | 24.7 |
| Investments | 0.4 | 0.9 | 3.0 | 7.2 | 14.7 | 15.3 | 15.1 |
| Military presence | 2.4 | 2.5 | 2.6 | 3.0 | 3.4 | 3.6 | 3.5 |
| % IEPG | 5.8 | 4.8 | 3.8 | 2.9 | 2.4 | 2.3 | 2.1 |
| Troops | 0.0 | 0.3 | 0.6 | 0.5 | 0.6 | 0.6 | 0.6 |
| Military equipment | 2.4 | 2.2 | 2.0 | 2.5 | 2.8 | 2.9 | 2.9 |
| Soft presence | 27.9 | 32.0 | 40.3 | 56.0 | 77.1 | 81.9 | 82.6 |
| % IEPG | 66.8 | 60.9 | 59.2 | 53.1 | 53.5 | 53.5 | 50.4 |
| Migrations | 0.8 | 1.0 | 1.7 | 4.4 | 6.1 | 6.1 | 6.1 |
| Tourism | 20.0 | 18.7 | 24.8 | 29.9 | 27.9 | 28.1 | 30.3 |
| Sports | 1.5 | 4.8 | 2.8 | 5.8 | 8.3 | 8.3 | 8.3 |
| Culture | 1.2 | 0.5 | 1.0 | 2.3 | 3.9 | 3.6 | 4.8 |
| Information | 0.0 | 0.0 | 0.1 | 1.0 | 8.6 | 14.5 | 14.5 |
| Technology | 0.7 | 0.8 | 1.1 | 1.1 | 1.5 | 1.5 | 1.5 |
| Science | 1.4 | 2.4 | 3.3 | 4.7 | 6.5 | 5.6 | 6.1 |
| Education | 0.8 | 1.8 | 3.4 | 1.5 | 4.0 | 4.6 | 4.6 |
| Development cooperation | 1.5 | 2.1 | 2.1 | 5.2 | 10.4 | 9.4 | 6.2 |
| IEPG value | 41.8 | 52.4 | 68.0 | 105.0 | 143.4 | 152.3 | 162.8 |
| position | 10 | 10 | 11 | 11 | 11 | 11 | 11 |
Conclusions: Were the European Union to take a qualitative step towards political federation, it would hold a strategic position that would probably alter the international political game and the world distribution of power and influence. However, in order to be sustainable, the trend towards a greater divergence between member States should be addressed. This particularly affects Spain, which is faced not only by the problems caused by the specific features of its presence in the European Union but also of its global presence as a whole.
Iliana Olivié, Senior Analyst for International Cooperation and Development and Coordinator of the IEPG, Elcano Royal Institute.
Manuel Gracia, Research assistant, Elcano Royal Institute.
[1] Take, for instance, the visionary work of Alice H. Amsden (2001), The Rise of ‘the Rest’: Challenges to the West from Late-Industrializing Economies, Oxford University Press.
[2] See, for instance, Andreas Fuchs & Krishna ChaitanyaVadlamannati (2012), ‘The Needy Donor: An Empirical Analysis of India’s Aid Motives’, World Development, nr 44, p. 110-128.
[3] Ian Bremmer & David Gordon (2011), ‘G-Zero’, Foreign Policy, 7/I/2011.
[4] Federico Steinberg & Ignacio Molina (2012), ‘El nuevo gobierno del euro: ideas alemanas, intereses divergentes e ideas comunes’, Revista de Economía Mundial, nr 30, p. 59-81; Benjamin Cohen (2012), ‘The Future of the Euro: Let’s Get Real’, Review of International Political Economy, vol. 19, nr 4, p. 689-700; Sebastien Dullien & José Ignacio Torreblanca (2012), ‘What is the Political Union?’, Policy Brief, nr 70, ECFR, December.
[5] Olivier Blanchard & Francesco Giavazzi (2002), ‘Current Account Deficit in the Euro Area: The End of the Feldstein-Horioka Puzzle?’, Brookings Papers on Economic Activity, nr 2, p. 147-186; Alberto Alesina & Robert Barro (2002), ‘Currency Unions’, Quarterly Journal of Economics, nr 117, p. 409-436; European Commission (2006), ‘Widening Current Account Differences within the Euro Area’, Quartely report on the euro area, Directorate General for Economic and Financial Affairs, p. 25-37; Jean Pisany-Ferry (2011), Le réveil des démons : La crise de l’euro et comment nous en sortir, Pluriel, Brussels.
[6] Iliana Olivié & Manuel Gracia (2013), ‘2012 IEPG: Methodology and New Analytic Tools’, WorkingPaper, nr 12/2013, Elcano Royal Institute, July.
[7]

[8] However, the most important change of position is that of Luxembourg, which gained nine in less than 10 years. This is mainly due to its high performance in the culture variable, which is measured with the exports of audiovisual services. It should be noted that, in this field, Luxembourg has a re-export profile. Moreover, the dramatic increase in services exports also contributed to the jump.
