
Theme[1]
The energy transition makes economic sense, regardless of one’s views on climate change.
Summary
We argue that the energy transition makes economic sense, regardless of one’s views on climate change. Through a comprehensive analysis of the costs of mature renewable technologies and their potential impact on retail power prices across four major European countries, we show that –contrary to what is generally thought– higher CO2 prices are not required for the energy transition to succeed; it is rather the expected decline in both utility-scale solar photovoltaic and onshore wind unsubsidised costs, due to ongoing technology improvements over time, that will really make a difference. Importantly, our analysis considers the intermittency of renewable generation by explicitly incorporating the costs of both energy losses and storage. All in all, we estimate positive Net Present Values (NPV) for the installation of solar and wind up to 80%-90% of the energy mix on average, even assuming flat real natural gas prices through 2030. A crucial implication of our results is that there is no reason to think that the energy transition could not be mostly, if not entirely, financed by the private sector. Based on our analysis, we also argue that policymakers should set an explicit policy goal of minimising energy costs by leveraging on the most competitive technologies available. Policies compliant with this goal will eventually lead to the economy’s decarbonisation, just like those emanating from the current rhetoric, but their nature will also be welfare-enhancing by achieving it at the minimum cost possible.
Analysis
(1) Introduction
The world is on a path to decarbonisation, albeit at different speeds, depending on the region (Systems Change Lab, 2022). The rationale behind this is straightforward: mitigating the potentially catastrophic consequences of climate change (IPCC, 2023) requires reducing greenhouse gas emissions to ‘net zero’, that is, to a state in which the greenhouse gases going into the atmosphere are balanced by their removal out of it, according to Oxford Net Zero.
The economic debate is about the precise path to reach ‘net zero’ as well as around the implications of the competing alternatives. Some think that the investments required to achieve the energy transition will be expansionary: the ‘positive demand shock’ view (see, eg, the latest drafts of most of Europe’s 2030 National Energy and Climate Plans or NECPs). Others, however, are concerned that the energy transition could likely lead to an accelerated obsolescence of the existing capital stock and a significant reallocation of resources: the ‘negative supply shock’ view (Pisani-Ferry, 2021). Within the later camp, Hannon & Nixon (2022) argue that the innovation and technological progress from the investments in the energy transition would probably be inadequate to offset the resultant negative supply shocks.
Contrary to these contradictory perspectives, we argue that the energy transition is likely to be expansionary and that the demand side would not be responsible for most of its impact. Instead, the supply side would be the major influential factor in the form of structurally lower energy prices driving permanent productivity and purchasing power gains for corporations and households, respectively. Hence, this analysis introduces the ‘positive supply shock’ view.
The rationale underpinning our view is that the state of technology is such that two renewable technologies –utility-scale solar photovoltaic and onshore wind– are already the cheapest forms of power generation.
To assess the economics of the energy transition, we first simulate the impact on retail power prices by degree of renewable penetration (from 50% to 97.5% of demand) across four European countries (Germany, France, Spain and the UK). The results reveal that real retail power prices could fall by between 11%-18% by 2030 (compared with 2019) as the share of renewables in the generation mix increases. Most importantly, we find that such price improvements tend to vanish, or even reverse when the share rises beyond the 80%-90% threshold. Secondly, we estimate economy-wide gains from structurally lower prices in the form of higher productivity and purchasing power gains from corporations and households, respectively. Finally, we calculate the Net Present Value (NPV) of the energy transition, defined as the present value of the estimated overall economy-wide gains, assumed to be permanent, discounted at a rate equal to each country’s potential real growth rate, and net of the net capex required to reach that point. We find positive NPVs for any share of renewables up to 80%-90% of demand across the four countries analysed. Among other implications, this also means that there does not necessarily need to be a trade-off between development and climate change in emerging markets, as suggested by some (see, eg, The Economist, 29/VI/2023).
Our analysis yields the following eight policy conclusions:
- The energy transition makes economic sense, regardless of one’s views on climate change.
- We do not really need higher CO2 prices for the energy transition to succeed; it is rather the expected decline in both utility-scale solar photovoltaic and onshore wind unsubsidised costs due to technology improvements that really make a difference.
- Our results hold even taking into account the intermittent nature of renewables by including the costs of both energy losses and storage to our analysis.
- We estimate the optimal energy mix (ie, that which minimises the wholesale power price) to feature a share of renewables of around 80%-90% of demand in 2030. Importantly, the share of renewables is likely to grow (and the wholesale price to fall) over time, as both solar and wind costs continue to fall beyond 2030.
- Installing batteries only makes financial sense if the share of renewables is above the threshold implied by the estimated optimal energy mix, suggesting that over-installing renewables is likely to be a cheaper alternative than batteries up to that point.
- Policy makers should ensure they keep part of their combined cycle power plants in service, regardless of their low utilisation, as a back-stop for the system via a ‘capacity’ or similar mechanism.
- Provided the energy transition relies on mature renewable technologies –such as utility-scale solar photovoltaic and onshore wind–, there is no reason to think that the energy transition could not be mostly, if not entirely, financed by the private sector.
- In order to maximise citizens’ engagement in the energy transition, policymakers should set an explicit policy goal of minimising energy costs by leveraging on the most competitive technologies available. Policies compliant with this goal will eventually lead to the economy’s decarbonisation, just like those emanating from the current rhetoric, but their nature will also be welfare-enhancing by achieving it at the minimum cost possible.
(2) The rationale: (some) renewables offer a potential for lower energy costs
Considering the most recent unsubsidised Levelized Cost of Energy (LCOE) values by technology in the US as compiled by Lazard (2023), both solar photovoltaic and onshore wind are currently the most competitive technologies available for power generation (see Figure 1). Importantly, if we also add storage costs, their respective LCOE increases. However, they remain broadly in line with that of Combined Cycle Gas Turbines (CCGT) and are still meaningfully lower than all other renewable and conventional technologies available.
Furthermore, it is expected that the costs of solar, wind and batteries will continue to decrease, as observed over the past few decades. For example, the US Department of Energy (2021) is targeting a 57% reduction in solar costs in the US by 2030. Also, IRENA (2019) expects the costs of onshore and offshore wind to fall by up to 50% and 62%, respectively, by 2030. In addition, the US National Renewable Energy Laboratory (NREL) expects long-term lithium-ion battery energy storage system (BESS) costs to fall by up to 47% in the US by 2030 (Murray, 2023).
Were these expectations prove to be realistic, both solar and wind costs (with and without storage costs) would be below unabated fossil fuel generation costs.
On the contrary, expectations for real natural gas (including CO2) prices range between flat to considerably higher (ENTSO-E, 2022a and 2022b; IEA, 2021; NGFS, 2021) when compared with their 2019 levels, if the latter is considered a ‘normal’ year, clean of the negative demand and supply shocks associated with the COVID-19 pandemic (2020-21) and Rusia’s war against the Ukraine (since 2022), respectively.
Figure 2 shows our estimates for the average real unsubsidised Levelized Cost of Energy (LCOE) by technology in 2019 and 2030 for the four European countries considered, based on the methodology described in Section 3.
A preliminary conclusion from Figures 1 and 2 is that a widening gap over time between the cost of mature renewable technologies (such as utility-scale solar photovoltaic and onshore wind), on the one hand, and natural gas (including CO2), on the other, should underpin the economic case for the energy transition. Ultimately, increasing the share of these two technologies in the generation mix should mechanically reduce power prices in virtually any region, with the installed capacity in each of them being a function of that region’s specificities and renewable resources.
(3) Our (standard) approach: solving an optimisation problem
This section outlines our methodological approach for assessing the economics of the energy transition. To simplify, we make three working assumptions. First, we focus on the economics of the energy transition within the power generation sector. This implies that our results should be understood as a lower bound of the broader impacts of electrification on the economy. Secondly, we assume power demand to remain static at 2019 levels and into perpetuity. This may come across as too strong an assumption. However, this is not the case in reality. In fact, our results hold true for virtually any level of demand, as the potential increase in terms of costs to supply the demand (higher renewable investments and electricity grids) would be proportional to the demand increase with a neutral effect in terms of overall cost per MWh consumed. Third, we assume real natural gas (including CO2) prices to also remain flat between 2019 and 2030. In this regard, we translate ENTSO-E’s (2022a) natural gas and CO2 nominal price forecasts from its National Trends scenario into a real natural gas (including CO2) price of €55 per MWh by 2030, on par with the one-year forward power price in Europe as of end-2019.
We also highlight that our analysis does not incorporate any positive second-round, country-level economic impacts from: (1) lower fossil fuel imports; (2) less-frequent natural disasters on the back of potentially slower global warming; or (3) the knock-on effects from higher potential growth stemming from permanent productivity gains due to structurally lower energy costs.
(3.1) The optimal mix
We start by taking electricity demand and generation data by technology at the shortest time span available from ENTSO-E (hourly data for France and Spain, 30-minute data for the UK and 15-minute data for Germany). The data span from January 2015 to November 2022 (the most recently available). Moreover, we also gather information from ENTSO-E concerning the installed generation capacity for each technology in each country by the end of December of all years.
We focus exclusively on three renewable-energy technologies along with storage: utility-scale solar photovoltaic, onshore wind, offshore wind and batteries. These technologies not only offer the cheapest means of electricity generation (as referred to in Figure 1) but also hold the potential to further reduce costs in the future (as shown in Figure 2). The installed capacity of hydropower is kept constant over time, on the assumption that this already-mature technology has been optimised in each of the four countries considered. With this approach, we calculate seven-year time series load-factor data (ie, the proportion of installed capacity actively utilised) in every 15/30/60-minute slot by country and renewable technology.
Batteries, however, require a somewhat different treatment given their different nature. Hence, we compare electricity demand and renewable generation in each time slot. If generation is above demand, we store as much of the excess generation as possible into the battery (and until the battery has been filled). Any generation above the battery’s capacity is lost. However, if generation is below demand, we allow the battery to ‘supply’ electricity until 100% of demand is met. If the battery falls short of the additional demand to be met, we estimate that residual demand will be covered by CCGTs. The purpose is to simplify the analysis, as such an additional demand could alternatively be met by Open Cycle Gas Turbines (OCGTs) or demand response.
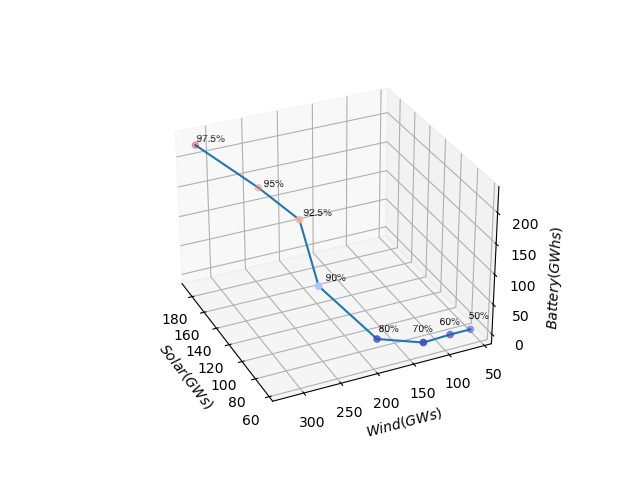
Next, we construct a four-dimensional surface that represents all possible energy-mix combinations that meet 100% of the demand in each 15/30/60-minute slot by country and degree of renewable energy penetration, considering thresholds at 50%, 60%, 70%, 80%, 90%, 92.5%, 95% and 97.5% of demand. We assume any residual demand (from 50%-2.5%) not covered by renewable technologies to be fully met by natural gas (CCGTs). Figure 3 shows our calculations for Spain. Needless to say, our results for the other three European countries are also available upon request.
We make two further assumptions to carry out these calculations. The first asserts that countries face no physical (eg, available sea/land, access to critical minerals) or administrative constraints (eg, bottlenecks in the approval process) for additional wind/solar farm installations. Secondly, that economic considerations are the only factor in deciding about the installation of each technology.
Figure 3. Spain: all possible combinations of the energy mix that meet 100% of demand in each time slot by degree of renewable energy penetration (% of demand): installed capacity (GW) for both wind and solar, energy capacity (GWh) for batteries
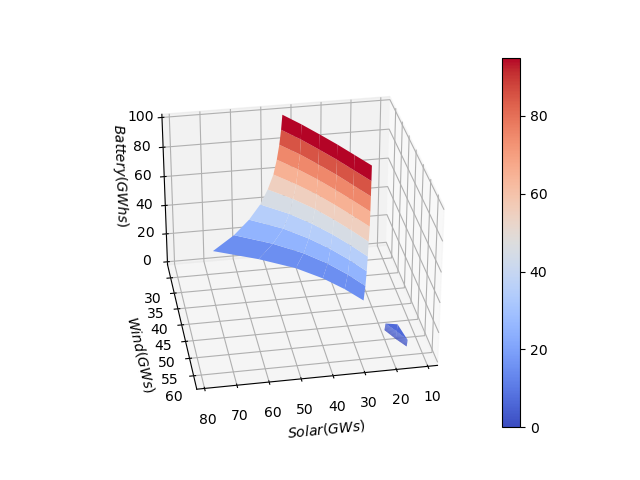

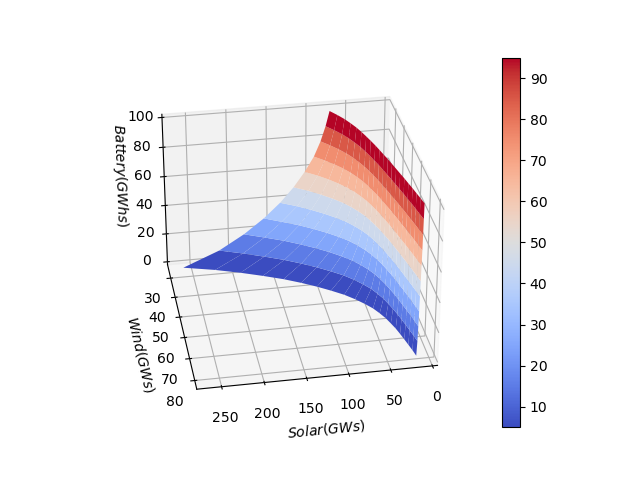
Note: we have converted our four-dimensional surfaces into three-dimensional surfaces by aggregating both onshore and offshore wind into one ‘wind’ category. However, this is only for illustrative purposes, as onshore and offshore wind are calculated separately.
Source: author’s calculations, ENTSO-E.
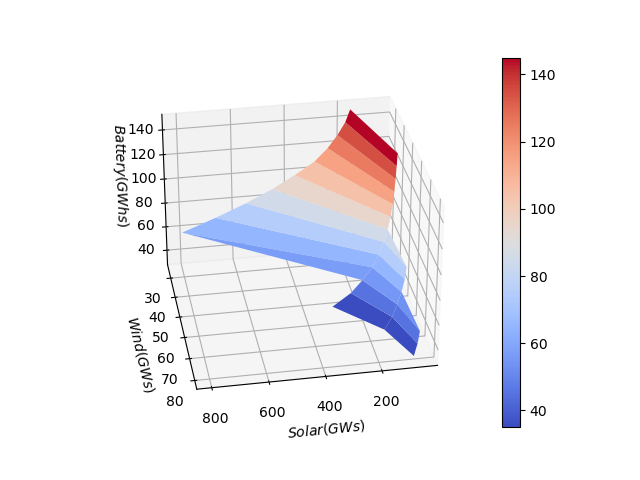
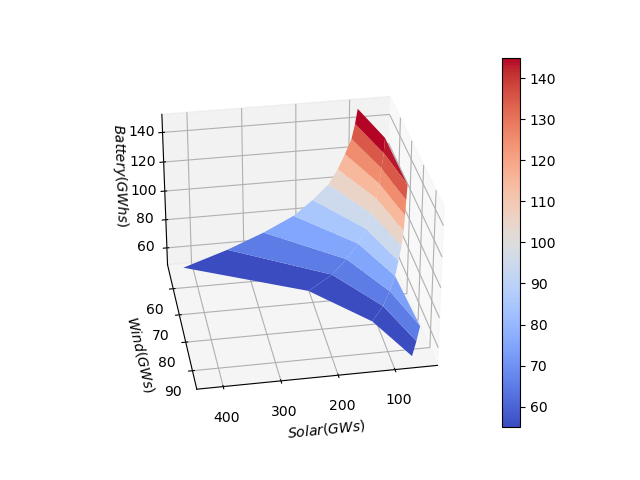
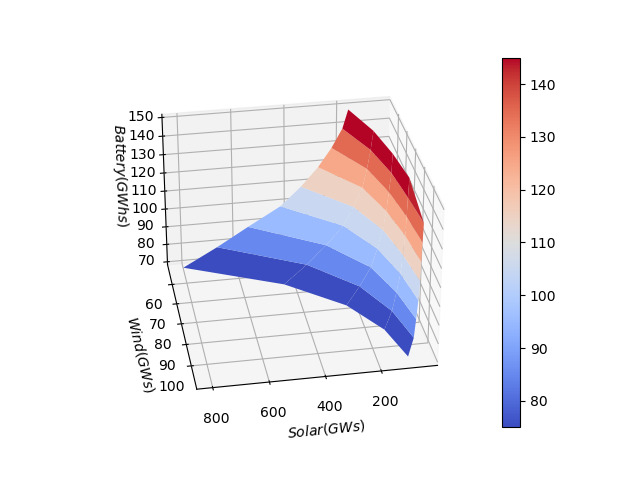
Next, for each point within the four-dimensional surface, we: (1) calculate the required capex; (2) identify the point of the surface that requires the minimum capex (referred to as ‘the optimal point’ as it allows covering 100% of demand with the mix of renewables that minimises the required capex); and (3) plot the ‘curve’ that links every optimal point for every degree of renewable penetration considered, by country (as shown in Figure 4).
Figure 4. Optimal energy mix by degree of renewable penetration and country: installed capacity (GW) for both wind and solar, energy capacity (GWh) for batteries
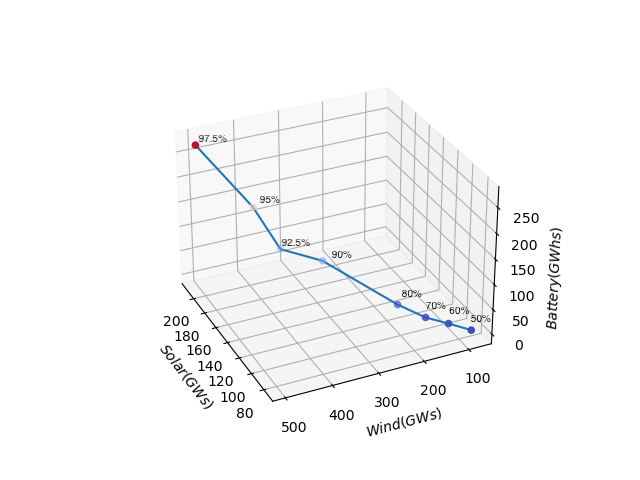
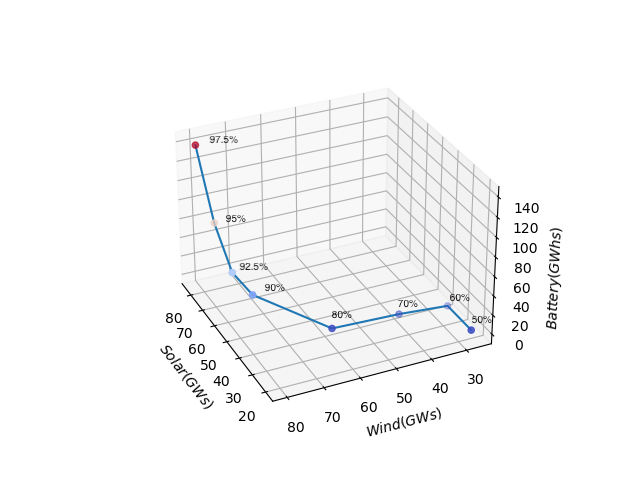
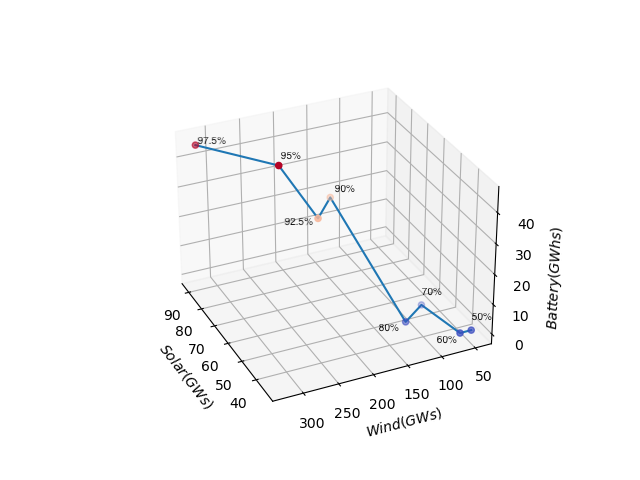
Note: four-dimensional surfaces are converted into three-dimensional surfaces by aggregating both onshore and offshore wind into one ‘wind’ category. However, the conversion is solely for illustrative purposes, as onshore and offshore wind are calculated separately (as explained in the main text).
Source: author’s calculations, ENTSO-E.
It is important to mention that the estimated energy mix would face no stability issues as the CCGTs, batteries and new wind turbines would provide stability to the grid, covering requirements such as inertia.
(3.2) Wholesale and retail power prices
Employing a three-step process, in parallel to the estimation of the optimal mix, we also calculate average electricity prices by country for each degree of renewable penetration. All LCOEs are calculated in real (ie, inflation-adjusted) values for 2019.
(3.3) Wholesale prices
To start with, we approximate the 2019 Levelized Cost of Energy (LCOE) for each renewable technology and country. Two factors are considered for this calculation: the average load factor estimated over the considered period and the required returns in line with actual market data. We assume that these technologies will obtain compensation through long-term supply contracts, such as Power Purchase Agreements (PPAs). This implies that all generation through renewable power plants will be remunerated, despite it exceeding actual demand. Later, the 2030 LCOE is calculated by integrating the presumed cost trajectory for solar and wind technologies over that period (as shown in Figure 2).
Secondly, we expect Combined Cycle Gas Turbines (CCGTs) to determine the marginal cost based on the carbon and gas power price assumptions from ENTSO-E’s (2022a) National Trends scenario. We see this as a conservative assumption as all the other scenarios run by ENTSO-E (2022a) assume higher commodity prices that would make renewable power plants even more price-competitive than implied by our analysis. It is also important to highlight that the amount to CCGTs is calculated to always cover demand by 15/30/60-minute slots. Consequently, we do not assume any demand response at all.
Thirdly, following Europe’s current electricity market design, we assume that hydropower plants will be remunerated at the marginal electricity cost (ie, just as CCGTs).
Finally, as estimated in the previous section, we will use the weights derived from the optimal energy mix of each country and compute wholesale prices as the weighted average of each technology’s LCOE individually.
(3.4) Retail power prices
For the four selected countries we obtain actual retail prices from Eurostat for 2019 (second half). The prices obtained are then split into wholesale prices (applying the one-year forward price/MWh in Europe as of end-2019) and other components, such as tariffs and taxes. We assume that there would be no change in the end-2019 tariffs and the effective tax rate (defined as taxes shelled out over the totality of wholesale prices and tariffs) over time for each country. Later, we combine our projected 2030 wholesale prices with end-2019 tariffs and the effective tax rate to calculate 2030 retail prices.
(3.5) Adjustments
We make three further adjustments to our estimated retail power prices.
First, we assume CCGTs are remunerated with a capacity payment on top of the marginal cost to cover all the fixed costs (maintenance capex and opex). This payment is to ensure that the CCGTs will continue to operate despite their relatively low usage. This could be considered a kind of insurance that is paid by consumers to guarantee the security of supply, increasing retail power prices as a result.
Secondly, we include the cost of the batteries assuming they receive a regulated remuneration, like electricity grids.
Finally, we deduct from retail prices the revenues that each government receives from the sale of CO2 permits. This has been put forward by several authors (Pütgen & Bamberger, 2021) and is already being implemented in some countries, such as Spain, as a measure to hedge consumers from the higher costs faced by pollutants.
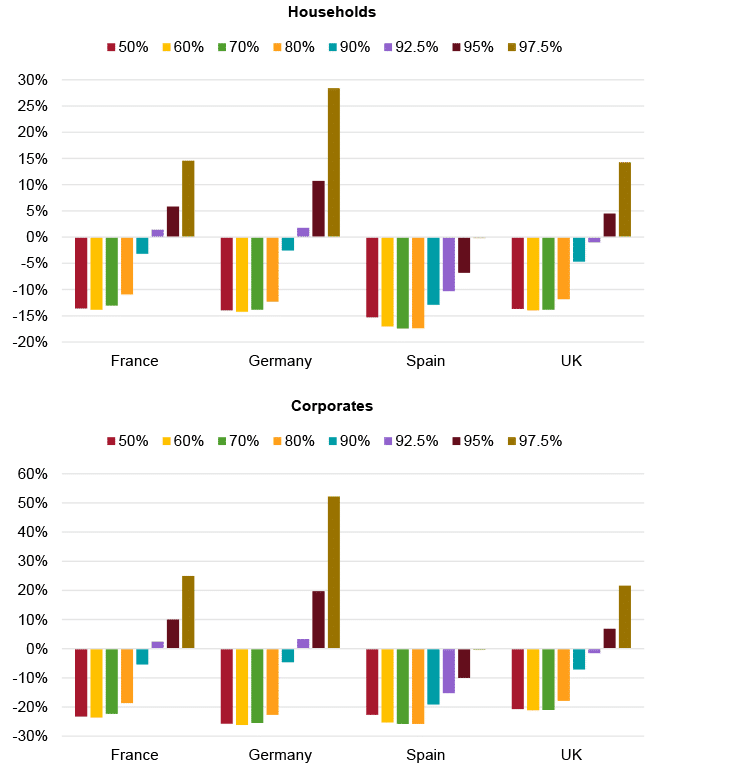
(4) The positive supply shock: lower power prices
Following the approach described in the previous section, our analysis yields the following results (see Figure 5): first, power prices –for both households and corporates– fall as the share of renewables in the generation mix rise; secondly, these price improvements tend to vanish when that weight rises beyond the 80%-90% threshold, although there are exceptions; and third, once the share of renewables is above the 80%-90% threshold, power prices tend to rise asymptotically. These three observations hold across the four countries considered, even though the impact seems to be more gradual in Spain.
Figure 5. Retail power price by degree of renewable penetration and country (real % change between 2019 and 2030)
Considering the drivers of the expected price evolution through 2030, most of the change is explained by the expected decline in the costs of both solar and wind energy generation, as well as of batteries (as shown in Figure 2). Also, we include the full reversion of government revenues associated with the sale of CO2 permits. The deflationary effect of these two factors is greater than the inflationary impact caused by the obligation of financing a capacity mechanism. The results for Spain (with renewable penetration at 80% of demand) are shown in Figure 6. Similar results for the other three European countries considered are available upon request.
Figure 6. Spain: retail power prices (real €/MWh) by degree of renewable penetration at 80% of demand; drivers of the expected evolution between 2019 and 2030
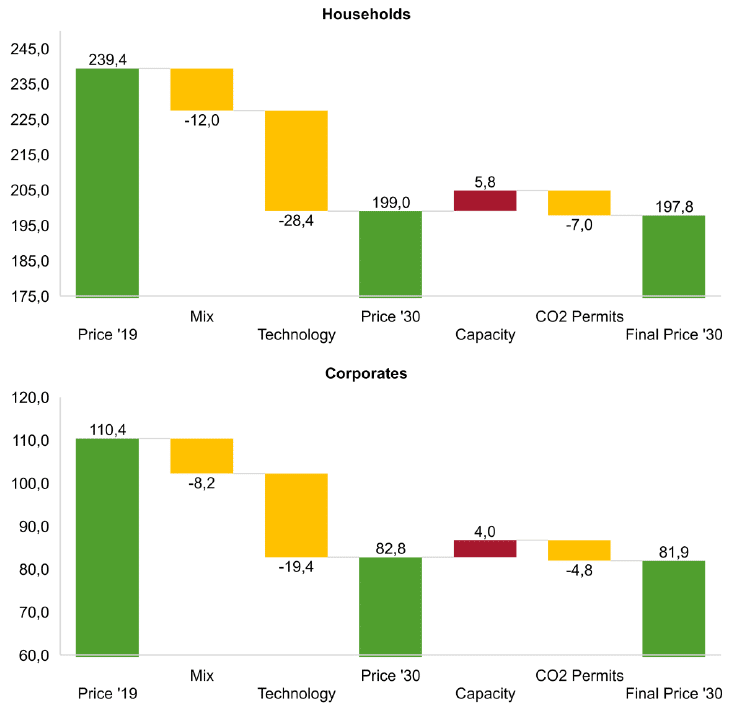
- Price ‘19: the actual retail power price (taking 2,500-5,000 kWh consumption for household consumers and 500-2,000 MWh for corporates) as of 2H 2019.
- Mix: the impact of transitioning to the country’s actual mix to its estimated optimal mix (Section 3.2) assuming unchanged LCOEs by technology.
- Technology: the impact from lower LCOEs for both solar and wind assumed between 2019-2030.
- Capacity: the impact from having a ‘capacity mechanism’ in place.
- CO2 permits: the impact from allocating all government revenues from the sale of CO2 permits to reducing power prices.
Note: ‘corporates’ refers to what Eurostat names ‘non-households’. Source: author’s calculations, Eurostat.
(5) Minimising power prices: the optimal energy mix
At this point, an obvious question should surface: if it is so easy to reduce power prices, why don’t we just do it? The answer is simple. While the current state of the technology would allow us to have a renewable-only power generation system (without subsidies), it would be too expensive. As shown in Figure 5, power prices tend to increase quasi-asymptotically once the share of renewables in the generation mix exceeds a certain threshold. This is due to the variability of renewable generation, which –beyond that particular point– can only be offset by over-installing renewable generation capacity.
In this regard, we find that the energy mix that minimises the electricity price is remarkably similar across countries, with wind (both onshore and offshore) being the largest source of electricity (Figure 7). The optimal mixes in France and Germany are considerably similar. In the UK, lower hydro would be compensated with higher wind. In Spain, however, the contribution of wind would be drastically lower than in the other countries, given the large contribution from solar (which is relatively cheaper due to comparatively higher load factors).
Considering that CCGTs mechanically account for the portion of demand not covered by renewables, it may be concluded that installed capacity should fall as the share of renewables grows. Although this is true, the relationship between the two is not linear. As shown in Figure 8, all countries need to keep a significant portion of their CCGT generation capacity in service –even with very low usage levels– to guarantee the security of supply. For example, covering 2.5% of demand with CCGTs (which is 95% less than in a scenario where CCGTs cover 50% of demand) would still require an installed capacity only 10%-15% lower, depending on the country. This finding underpins the need for a ‘capacity mechanism’ that we have already incorporated into our power price estimates.
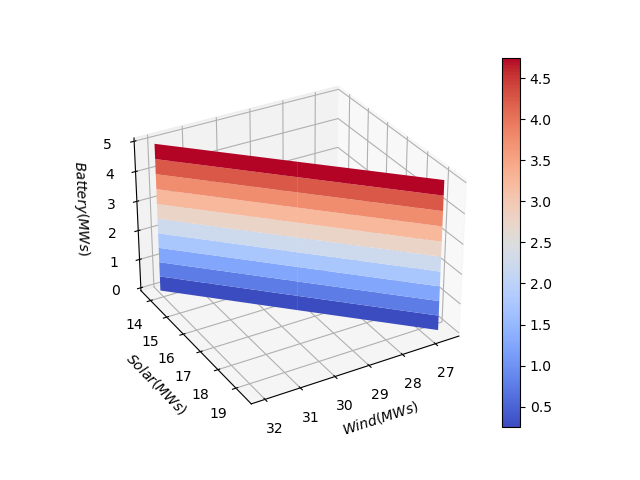
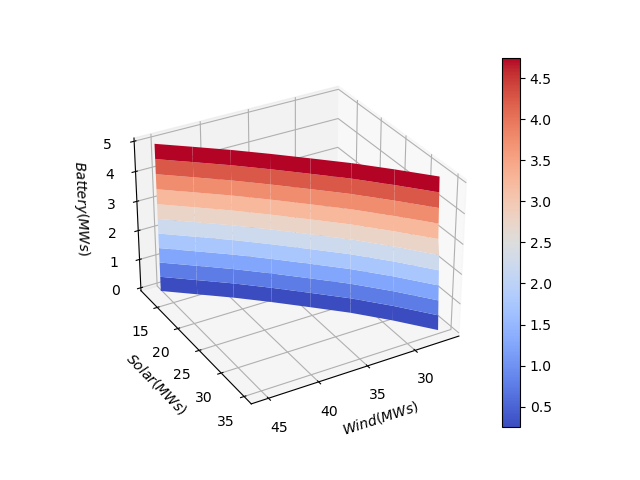
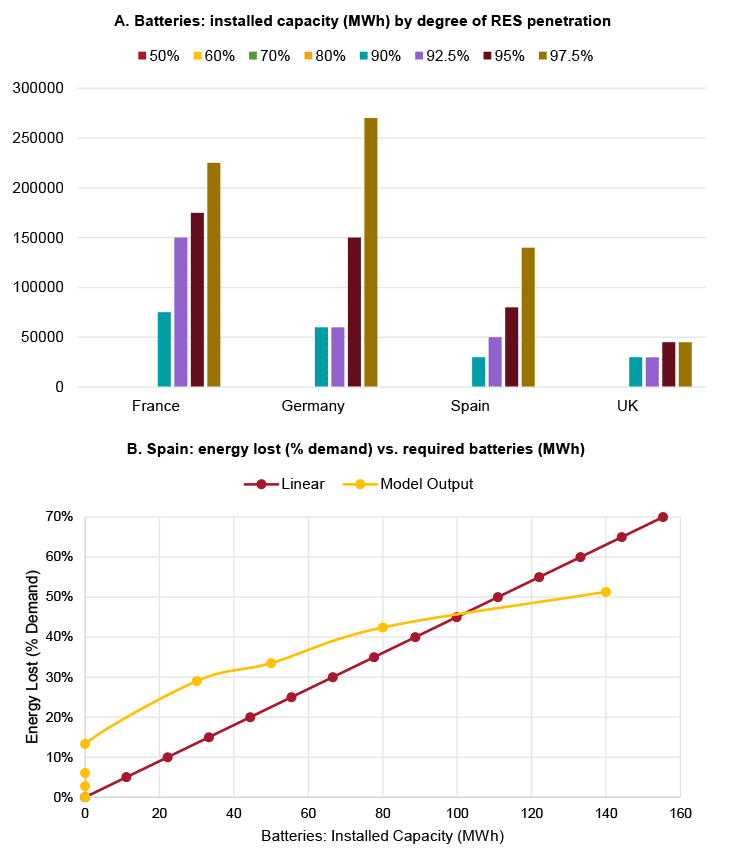
Another interesting observation is that none of the four countries considered seem to need any electricity storage for a degree of penetration of renewables under the 80% threshold (Panel A of Figure 9). Figure 7 shows that the amount of lost energy differs per country, ranging from 13% of demand in Spain to 26% in the UK, in a scenario where renewables account for 80% of demand. One might expect batteries installed to be proportional to the amount of lost energy. However, this is not necessarily true. In deciding whether to install batteries or not, there is a trade-off between the cost of installing the required batteries and the cost of installing additional renewable capacity (solar, wind or both). Panel B of Figure 9 shows the results of such a trade-off for Spain (for illustrative purposes).
Figure 9. Batteries
(6) The capex required to reach the optimal mix
The net capex required to reach a penetration of renewables of 80% ranges from 4% in Spain to 8.5% in France. Generally, net capex will be higher (lower) where renewable penetration is lower (higher) currently. Hence, the starting point maters. Figure 10 shows our net capex estimates, defined as gross capex less the capex already committed in each country.
(7) The economics of the energy transition: a cost-benefit analysis
In this section we run a cost-benefit analysis to assess whether the energy transition makes economic sense or not (for each degree of renewable penetration between 50% and 97.5% of demand).
First, using Eurostat’s input-output tables by country for 2018 (the latest available), we calculate firm productivity gains by sector resulting from our expected reduction in retail prices for corporates. Only corporate power price change is assumed, keeping everything else constant. Similarly, we also calculate household purchasing power gains by mixing consumer-level data from the input-output tables and the breakdown of the 2019 HCPI in each country (also obtained from Eurostat), and following the same approach as before, but applying our expected decline in retail prices for households.
Secondly, we aggregate productivity and purchasing power gains by corporates and households, respectively, to estimate the overall economy-wide gains from lower power prices, which we assume to be perpetual, in each country.
Finally, we calculate the Net Present Value (NPV) of the energy transition by country and degree of renewable penetration, which we define as the present value of a permanent income equal to the overall economy-wide gains estimated earlier, discounted at a rate equal to each country’s potential real growth rate (taken from the IMF’s WEO database, April 2023), net of the net capex required to reach that point.
According to the results (shown in Figure 11), the energy transition within the power generation sector makes economic sense (positive NPV) up to a degree of renewables penetration of around 80%-90% of demand for most countries. In the case of Spain, however, our results suggest that this could hold true for a degree of renewables penetration of up to 95% of demand.
(8) What about the ‘last mile’?
Some readers –especially those particularly concerned with climate change who favour decarbonisation over energy cost minimisation– may be wondering about what to do with the ‘last mile’, that is, with the last 10% of demand for which electrification would be too costly (see Figure 11).
The answer is that probably a few things could be done. First of all, the passage of time may do part of the job, as we expect solar and wind costs to continue to fall beyond 2030. Secondly, demand response (potentially even remunerated under the umbrella of a ‘capacity mechanism’) could also play a more active role, something that we have not considered in our analysis. And, third, a number of other technologies might also play a residual role, including temporary solutions such as the life extension of fully-amortised nuclear power plants or even ‘expensive’ technologies such as green hydrogen and/or biogas, given that they become competitive as the cost of installing additional renewables increases.
Conclusions
Our analysis yields the following eight policy conclusions.
First and foremost, given the current and expected state of technology, the energy transition makes economic sense, regardless of one’s views on climate change.
Secondly, while higher CO2 prices (as expected by ENTSO-E, 2022b; IEA, 2021; and NGFS, 2021) would obviously accelerate the energy transition by making fossil fuels relatively less price-competitive than renewable technologies over time, we show that we do not really need higher exogenous CO2 prices for the energy transition to proceed. Rather, lower solar and wind costs are likely to do the job, even assuming flat real natural gas (including CO2) prices over time.
Third, we address any concerns about the intermittent nature of renewable technologies, particularly solar, by explicitly incorporating the costs of both energy losses and storage (in the form of batteries) into our estimates.
Fourth, given the current and expected state of technology, we find the estimated optimal energy mix (ie, that which minimises the wholesale power price) in 2030 generally features a share of renewables of around 80%-90% of demand (95% in Spain). Importantly, such a share is likely to grow over time as both solar and wind costs continue to fall beyond 2030.
Fifth, installing batteries only makes financial sense if the share of renewables is above the threshold implied by the estimated optimal energy mix, suggesting that over-installing renewables is likely to be a cheaper alternative than batteries up to that point.
Sixth, policymakers should ensure they keep part of their combined cycle power plants in service, regardless of their low utilisation, as a backstop for the system via a ‘capacity’ or similar mechanism.
Seventh, provided the energy transition relies on mature renewable technologies, such as utility-scale solar photovoltaic and onshore wind, there is no reason to think that the energy transition could not be mostly, if not entirely, financed by the private sector. However, any departure from this by including less-mature technologies in the energy mix (such as, eg, green hydrogen and/or biogas; see Figure 1) would likely increase real retail power prices, relative to our estimates, potentially requiring a higher share of government funding and/or subsidies.
Last but not least, decarbonisation may not be possible without citizens’ broad engagement. Therefore, in a context of elevated polarisation (Herold, Joachim, Oteni & Vorländer, 2023), policy-makers should set an explicit policy goal of minimising energy costs by leveraging on the most competitive technologies available. These policies should include an application of any government revenues from the sale of CO2 permits to reduce retail power prices (as already considered in our analysis). Most importantly, policies compliant with this goal will eventually lead to the economy’s decarbonisation, just as those emanating from the current rhetoric, but their nature will also be welfare-enhancing by achieving it at the minimum cost possible.
References
ENTSO-E (2022a), TYNDP 2022 Scenario Building Guidelines | Version. April 2022 (entsos-tyndp- scenarios.eu)
ENTSO-E (2022b), European Resource Adequacy Assessment 2022 | Annex 1 – Input Data & Assumptions (azureedge.net)
Hannon & Nixon (2022), Can the clean energy transition boost global growth? (spe.org.uk)
Herold, Joachim, Oteni, & Vorländer (2023), TUD_MIDEM_Polarisationsstudie_ENG_AK09.indd (forum-midem.de)
IEA (2021), Net Zero by 2050 – Analysis - IEA
IPCC (2023), AR6 Synthesis Report: Climate Change 2023 — IPCC
IRENA (2019), Future of wind (irena.org)
Lazard (2023), 2023 Levelized Cost of Energy+ | Lazard
Murray (2023), BESS costs could fall 47% by 2030, says NREL (energy-storage.news)
NGFS (2021), NGFS Scenarios Portal
Oxford Net Zero (nd), What is Net Zero? - Net Zero Climate
Pisani-Ferry (2021), Climate policy is macroeconomic policy, and the implications will be significant | PIIE
Pütgen & Bamberger (2021), Electricity: humanity’s low-carbon future (worldscientific.com)
Systems Change Lab (2022), State of Climate Action 2022 | Climate Action Tracker
The Economist (2023), How misfiring environmentalism risks harming the world’s poor (economist.com), 29/VI/2023
US Department of Energy (2021), 2030 solar cost targets | Department of Energy
[1] Opinions are those of the authors and do not necessarily represent those of the institutions they are (or have previously been) associated with, including the World Bank Group.