

Summary
The Spanish economy became too dependent on internal, as opposed to external, demand as the driver of growth, particularly the construction sector. The collapse of this sector brutally exposed the shortcomings of the lopsided economic model and caused unemployment to skyrocket. The economy needs to become more internationalisedthrough exports and direct investment abroad by its companies and banks in order to create jobs on a more sustainable basis andemployment of a higher quality.
Background
Spain suffered its worst recession in 2009 since 1960, the starting point for the current data series. The economy’s shrinkage last year (-3.6%) was only the third one in 50 years and by far the deepest (-0.2% in 1981 and -1.2% in 1993). After growing by an average of 3.5% for 14 years (above the potential growth rate of close to 3%), the overheated economy was hard hit by the collapse of its over-sized property sector and the fallout from the global financial crisis, although only one of Spain’s banks –Caja Castilla-La Mancha (CCM), a tiny savings and loan institution– had to be rescued by the Bank of Spain (the central bank). Not a cent of Spanish taxpayers’ money has been spent on bank bail-outs (CCM was rescued by using accumulated deposit guarantee funds).
In 2007, the last year of ‘normal’ growth in Spain, investment in the construction sector accounted for 15.7% of GDP, compared with 9% in the US, Germany, France, the UK and Italy.[2] The driving force was residential construction which at its peak accounted for 10% of GDP, compared with 6.5% of GDP in the US before its own housing market went under.
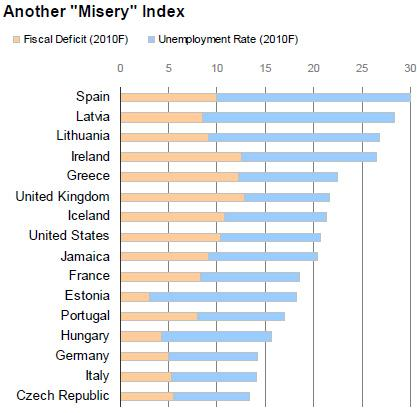
A labour-intensive sector, construction created one in every five new jobs in Spain between 2000 and 2007. At the end of 2009, however, more than 781,000 construction workers had lost their jobs, and there were an estimated 800,000 new properties destined for sale that had not been sold (including many held by banks that received them in lieu of loan repayments from developers) and an unknown number of second-hand properties. In boom times, Spain creates jobs at a faster pace than any other EU economy, but during a downturn they are destroyed at an equally brisk speed. Spain generated close to 12% of the Euro zone’s GDP in 2009, but it accounted for more than one-quarter of the zone’s unemployed. The seasonally adjusted jobless rate reached a low of 7.9% in the second quarter of 2007 (1.76 million people) and then rose inexorably to close to 20% at the end of 2009, almost double the euro area rate (see Figure 1), while the fiscal balance over the same period moved from a surplus of 2.9% of GDP to a deficit of more than 10% and general government gross debt increased from 36.1% of GDP to 54%. In absolute terms, Spain has almost the same number of unemployed as France and Poland combined. The most worrying aspect is the youth unemployment rate (under 25’s) of 44%. According to José Manuel Campa, the Secretary of State for the Economy, the overall jobless rate will not return to its pre-crisis single figures rate until 2014 or 2015. The dramatic rise in unemployment put Spain in first place in the ‘misery index’ of Moody’s, the credit rating agency (see Figure 2).
Figure 1. Seasonally Adjusted Unemployment Rates (%)
| November 2008 | November 2009 | |
| France | 8.3 | 10.0 |
| Germany | 7.1 | 7.6 |
| Italy | 7.1 | 8.3 |
| Spain | 14.0 | 19.4 |
| Euro zone | 8.0 | 10.0 |
Source: Eurostat.
Figure 2. Moody’s ‘Misery Index’ (1)
Source: Moody’s.
For more than a decade, Spain’s political class was happy to encourage the phenomenal growth of the property sector without giving thought to the bubble that was clearly being created or what would take its place after it burst. The boom started during the government of the right-wing Popular Party (1996-2004) and continued under the Socialists. For many economists it was, to borrow the title of a novel by Gabriel García Márquez, a chronicle of a death foretold. The only question was when the slump would happen; the global financial crisis was the trigger that hastened it. The number of housing starts in 2006 (865,561) was more than France, Germany, the UK and Italy combined (see Figure 3). The sector had a big knock-on impact on the rest of the economy. A one percentage point rise in construction demand produced a multiplier effect of almost double that on the country’s overall output. Lots of jobs were created, but the reclassification of land by town halls for building purposes caused corruption to flourish.[3]
Figure 3. Housing Starts, 2000-09
| Year | Number |
| 2000 | 535,668 |
| 2001 | 502,583 |
| 2002 | 524,181 |
| 2003 | 636,332 |
| 2004 | 687,051 |
| 2005 | 724,652 |
| 2006 | 865,561 |
| 2007 | 651,427 |
| 2008 | 264,795 |
| 2009 (1) | 93,291 |
(1) First 10 months.
Source: Development Ministry.
The Organisation for Economic Co-operation and Development (OECD) cited nine factors that propelled Spain’s property market. First and foremost, low nominal interest rates (negative or neutral in real terms) that came when Spain joined the euro and the corresponding improvement in financial terms in mortgage lending. Secondly, the 4.1 million rise in the population between 2000 and 2006, almost entirely as a result of the influx of immigrants. Third, increasing purchases of second homes by foreigners. Fourth, the baby boom came later in Spain than in most countries, so that the share of the population of household formation age is almost among the highest in Europe. Fifth, the steady increase in the female participation rate raised the number of two-income households, making purchasesmore affordable for couples. Sixth, the rise in disposable income stemming from the very long period of economic growth. Seventh, investment in alternative assets, such as housing, after the downturn in the stock market in 2001 and 2002. Eighth, the very favourable tax treatment of house purchases. And ninth, the very restrictive legal environment for house renting. There were good reasons for a building boom, but not to the extent that was reached. As a result, the economy, in the words of the International Monetary Fund (IMF) became ‘lopsided’ as it was too reliant on bricks and mortar. There is thus a pressing need to create a more sustainable economic model. This entails, among other things, a greater internationalisation of companies through exports and acquisitions of or mergers with companies abroad. Spain has made great advances on the globalisation road in the last 20 years, but still has a long way to go.
The ‘Sustainable Economy’ Law
The draft bill of the government’s ‘sustainable economy’ law (some 200 pages), presented to parliament last December, aims to get the economy moving and lay the foundations for a more productive structure based, to a greater extent, on knowledge, high technology and green energy. The structure of the Spanish economy has changed considerably in the last three decades. Agriculture’s share of GDP dropped from 10% in 1975 to less than 3% (see Figure 4). In 1960, 41% of the working population was employed in agriculture, 29% in 1970, 22% in 1975 and around 3% today. In its place, the economy became much more dependent on construction and tourism than the other big EU economies (in 2006 they generated close to one quarter of GDP) and these two sectors also became unhealthily intertwined. Too much of the productive structure was literally built on sand. Vast swathes of Spanish coastline have been ravaged by the building of apartment blocks and hotels in a bid to attract more and more mass tourism and homes for foreigners.[4] The total number of foreign visitors who arrived in Spain in 2009 was 8.7% lower at 52 million, the lowest figure since 2003, and largely because of the arrival of fewer Germans and Britons, but its downturn was nowhere near as severe as that of the construction sector. In the long-term, however, it is far from certain that Spain can continue to attract such numbers as the sector has lost competitiveness and other countries which offer better price-quality are emerging, such as Turkey.
Figure 4. Structure of Gross Domestic Product (%)
| Primary sector | Energy | Industry | Construction | Market Services | Non-market Services | |
| 1995 | 4.5 | 3.9 | 17.9 | 7.5 | 50.6 | 15.6 |
| 2000 | 4.3 | 2.7 | 18.1 | 8.3 | 51.7 | 14.9 |
| 2001 | 4.2 | 2.6 | 17.6 | 8.9 | 52.4 | 14.3 |
| 2002 | 4.0 | 2.6 | 16.9 | 9.4 | 52.7 | 14.4 |
| 2003 | 3.9 | 2.7 | 16.2 | 9.9 | 52.7 | 14.6 |
| 2004 | 3.6 | 2.7 | 15.8 | 10.6 | 52.8 | 14.5 |
| 2005 | 3.2 | 2.7 | 15.3 | 11.5 | 52.6 | 14.7 |
| 2006 | 2.8 | 2.6 | 15.1 | 12.0 | 53.2 | 14.3 |
| 2007 | 2.7 | 2.6 | 14.7 | 11.8 | 53.3 | 14.9 |
| 2008 | 2.6 | 2.7 | 14.3 | 11.4 | 53.9 | 15.1 |
| 2009E | 2.6 | 2.5 | 12.6 | 10.8 | 55.4 | 16.1 |
Source: National Statistics Office (INE) and estimates by Analistas Internacinales Financieros (Afi).
The economy, as a whole, and not just tourism has lost competitiveness, particularly against the euro zone, which accounts for close to 60% of Spain’s exports of goods and services. This is due to an inflation rate that in most years since Spain joined the single currency (in 1999) has been more than a percentage point above the zone’s average and to lower productivity gains than other countries. Productivity growth in Spain has been sluggish over the last decade (around 0.5% on average).
In the 10 years since the Lisbon Strategy was launched by the European Council, Spain has made very little progress. The Strategy was a blueprint for turning Europe into the world’s most competitive economy and was based on three pillars: (1) a knowledge-based economy, encouraging R&D; (2) employment, with the core target of improving employment rates; and (3) the environment, with the aim of reducing greenhouse gas emissions. Spain made considerable progress until 2008 in moving towards the target of 70% for the employment participation rate by 2010, but this was undone by the recession and the very fast rise in unemployment. At the end of 2009, 59.8% of the working population was employed, while R&D expenditure was less than half the target of 3% of GDP.
Spain has steadily declined in the World Economic Forum’s (WEF) and the IMD’s rankings, the two most serious studies measuring competitiveness on the basis of many indicators and facets (see Figures 5 and 6). It dropped from 28th place in 2006 to 33rd in 2009 in the WEF’s ranking and from 31st to 39th in 2009 in the IMD’s classification over the same period.
Figure 5. World Economic Forum’s Competitiveness Ranking: Top 10 and Spain, 2006-09
| 2009 | 2008 | 2007 | 2006 | |
| Switzerland | 1 | 2 | 2 | 1 |
| US | 2 | 1 | 1 | 6 |
| Singapore | 3 | 5 | 7 | 5 |
| Sweden | 4 | 4 | 4 | 3 |
| Denmark | 5 | 3 | 3 | 4 |
| Finland | 6 | 6 | 6 | 2 |
| Germany | 7 | 7 | 5 | 8 |
| Japan | 8 | 9 | 8 | 7 |
| Canada | 9 | 10 | 13 | 16 |
| Netherlands | 10 | 8 | 10 | 9 |
| Spain | 33 | 29 | 29 | 28 |
Source: World Economic Forum.
Figure 6. IMD’s Competitiveness Ranking: Top 10 and Spain, 2006-09
| 2009 | 2008 | 2007 | 2006 | |
| US | 1 | 1 | 1 | 1 |
| Hong Kong | 2 | 3 | 3 | 2 |
| Singapore | 3 | 2 | 2 | 3 |
| Switzerland | 4 | 4 | 6 | 8 |
| Denmark | 5 | 6 | 5 | 5 |
| Sweden | 6 | 9 | 9 | 14 |
| Australia | 7 | 7 | 12 | 6 |
| Canada | 8 | 8 | 10 | 7 |
| Finland | 9 | 15 | 17 | 10 |
| Netherlands | 10 | 10 | 8 | 15 |
| Spain | 39 | 33 | 30 | 31 |
Source: IMD.
Spain’s position in all four of IMD’s categoriesdeteriorated (see Figure 7).
Figure 7. Spain’s Classification in the IMD Categories, 2006-09
| 2009 | 2008 | 2007 | 2006 | |
| Economic performance | 46 | 30 | 27 | 32 |
| Government efficiency | 43 | 34 | 29 | 34 |
| Business efficiency | 45 | 40 | 33 | 36 |
| Infrastructure | 31 | 30 | 29 | 26 |
Source: IMD.
Another measure of competitiveness is the real effective exchange rate. Taking the year 2000 as 100, Spain’s rate had appreciated by 2008 to 118 in terms of consumer inflation differentials and 127 in terms of unit labour costs.[5] Both inflation and unit labour costs have increased in Spain at a faster pace that the country’s main trade partners, and the euro strengthened against other currencies. Spain can do nothing about the euro, membership of which removes devaluation as a weapon to restore competitiveness, but it can do something about inflation and unit labour costs.
The OECD pointed out in its latest outlook (November 2009) that nominal wages in Spain in 2009 had not adjusted fully to labour market conditions, despite the steep rise in unemployment. The activation of indexation clauses, in line with the inflation rate recorded in 2008, caused nominal wages to grow faster in 2009 yet again than the euro area average and above the expected inflation rate (the harmonised index of consumer prices rose 4.1% in 2008 compared with an OECD forecast of -0.4% in 2009). After recording 3.75% growth in 2009, the OECD projected the pace of growth of real compensation per employee to decelerate to 1.75% in 2010, which would still be above productivity growth. ‘This disconnection between wages and productivity developments is undermining the competitive position of the Spanish economy’, the OECD stated. Spain’s growth in wage costs between 2000 and 2008 was the highest of the large euro zone economies (see Figure 8).
Figure 8. Growth in Labour Costs in the Euro Zone (average annual percentage)
| 1995-2000 | 2000-08 | |
| Finland | 2.9 | 4.1 |
| France | 2.6 | 3.4 |
| Germany | 2.5 | 2.2 |
| Italy | 1.8 | 3.5 |
| Spain | 4.4 | 4.7 |
| Pro memoria: US | 2.8 | 3.7 |
Source: IWD, Cologne.
Among the ‘sustainable economy’ law’s measures are:
- A €20 billion fund (2% of GDP) to finance projects in ‘sustainable tourism’, energy efficiency improvements, biotechnology, aerospace and health, and to provide cash and guarantees to credit-starved companies.
- Creation of companies in a maximum of five days compared with the current estimated average of 47 days and an OECD average of 13 days.
- Public administrations will make their payments within 60 days. Small companies, unable to obtain loans because of the credit crunch, have been going out of business because of late or non-payment by administrations, particularly town halls whose revenues have plummeted because of the property market slump.
- Tax deduction for restoring homes in certain conditions.
- A shorter working week based on the German model when employment levels need to be adjusted.
In the opinion of many economists, the law is a hotchpotch of measures and good intentions and represents a very timid first step. It is nowhere near sufficient to create a more sustainable economic model or make the economy more competitive and productive. Mauro Guillén, a professor at Wharton business school in the US, calls the law a ‘drop in the ocean’, while Mariano Rajoy, the leader of the Popular Party (PP) described it as ‘a luminous sign on an empty plot’.
The measures do nothing to improve Spain’s ailing education system, the cornerstone of a more productive economic structure. The two main political parties have failed to reach agreement on how to resolve the crisis in education –a consensus is needed– and in the event that they did it would take at least a decade before any improvements were noted and played a positive role in creating a more knowledge-based economic model. The law also does not tackle the re-training of the unemployed and lacks a clear focus.[6]
Education: The Key to a More Productive Economy
Spain’s education system, in the 35 years since the death of General Franco, has become one of the most equitable among industrialised countries, but it has major shortcomings. It should not be forgotten, however, that basic secondary education only became compulsory and free 27 years ago. The problems include:
- Almost one in three people between the ages of 18 and 24 in 2007 (the latest year available) are early school leavers as they did not complete their basic education.[7] This is twice the EU average. The trend is improving because young people, who abandoned their studies for a job (often in the construction sector or tourism) which they have now lost, are completing their education and those at school see no prospect of finding employment and so are continuing their education.
- Spain scores badly in the PISA tests for 15-year olds on reading, mathematical and scientific literacy conducted by the Paris-based Organisation for Economic Co-operation and Development (OECD).
- The vocational training system is adequate, but the offer is insufficient and particularly so in the current crisis.
- Between 25% and 35% of students, depending on the university, drop out before graduation and only around one-third complete their studies on time.
- No Spanish university is in the top 150 of the Times Higher Education Supplement ranking or in that of Shanghai’s Jiao Tong University.
On the positive side, since 2007 Spain has had more adults with an educational attainment above that of compulsory secondary education (known in Spain as ESO) than below it. The respective figures are 51% and 49% (see Figure 9). Ten years ago, the proportion of adults that had only completed ESO (12-16 year olds) and had not studied further was 11 pp lower at 69% (see Figure 10). However, only Mexico, Portugal and Turkey have lower levels than Spain among OECD countries. Nevertheless, given that secondary education has only been compulsory and free in Spain for 27 years, compared with more than 100 years in some countries, the progress made is a noteworthy achievement.
Figure 9. Educational Attainment of Adult Population (1) in Selected Countries (% of total)
| Below uppersecondary | Upper secondary and post-secondary non-tertiary | Tertiary | |
| US | 12 | 48 | 40 |
| UK | 14 | 54 | 32 |
| Germany | 16 | 60 | 24 |
| Finland | 19 | 44 | 36 |
| OECD average | 31 | 42 | 27 |
| France | 31 | 42 | 27 |
| Italy | 47 | 39 | 13 |
| Spain | 49 | 22 | 29 |
| Turkey | 71 | 18 | 11 |
(1) Aged 24-64 years and figures for 2007, the latest year.
Source: Education at a Glance 2009, OECD.
Figure 10. Below Upper Secondary Education Trends, 1997-2007 (% of total)
| 1997 | 2007 | |
| US | 14 | 12 |
| UK | 41 | 32 |
| Germany | 17 | 16 |
| Finland | 32 | 19 |
| OECD average | 37 | 30 |
| France | 41 | 31 |
| Italy | 59 (1) | 48 |
| Spain | 69 | 49 |
| Turkey | 79 | 71 |
(1) Figure for 1998. No figure available for 1997.
Source: Education at a Glance 2009, OECD.
Spain is only one of two EU countries (the other is Germany) where the proportion of the population aged between 20 and 24 that has upper secondary education has declined (from 66% in 2000 to 61% in 2007, well below the EU averages in both years). The Czech Republic, which joined the EU in 2004, is ranked first and Portugal last (see Figure 11).
Figure 11. Youth Education Attainment Level in the EU, Selected Countries (1)
| 2007 | 2000 | |
| Czech Republic | 91.8 | 91.2 |
| Poland | 91.6 | 88.8 |
| Finland | 86.5 | 87.7 |
| France | 82.4 | 81.6 |
| UK | 78.1 | 76.7 |
| EU-27 | 78.1 | 76.6 |
| Italy | 76.3 | 69.4 |
| Germany | 72.5 | 74.7 |
| Spain | 61.1 | 66.0 |
| Portugal | 53.4 | 43.2 |
(1) % of people aged between 20 and 24 with the equivalent of at leastupper secondary education.
Source: Eurostat.
The influx of poorly-educated immigrants over the past decade, most of them under the age of 30, is not the main reason for the decline in the upper secondary education attainment level, nor is the relatively low level of public spending on education (see Figure 12). Spain spends 4.3% of its GDP on education, not much less than Germany’s 4.5%, and yet Germany’s PISA results and attainment level, for example, are considerably better. This suggests that the solution is much deeper than simply throwing money at the problem.
Figure 12. Public Spending on Education (% of GDP), Selected EU Countries
| 2007 1 | 2000 | |
| Denmark | 8.3 | 8.29 |
| Sweden | 7.1 | 7.21 |
| France | 5.7 | 6.03 |
| UK | 5.5 | 4.46 |
| Poland | 5.5 | 4.89 |
| Germany | 4.5 | 4.55 |
| Italy | 4.4 | 4.46 |
| Spain | 4.2 | 4.28 |
(1) Provisional data.
Source: World Development Indicators, 2009, World Bank.
Even in 2000, when foreigners’ share of Spain’s population was only 2.3%, compared with 10% in 2007, Spain’s attainment level was still the second lowest after Portugal. And whereas Portugal improved by 10 pp between 2000 and 2007 (from a very low level), Spain’s dropped by five points. All but one of the central and eastern European countries (Rumania) that joined the EU in 2004 and 2007 have education attainment levels above the EU-27 average.
Spain’s performs badly in the tests conducted by the Programme for International Student Assessment (PISA). It is below the OECD average in all three categories (see Figure 13). Fewer than 5% of 15-year olds were top performers in the latest assessment (2006) compared with more than 13% in countries such as Canada, Finland, the Netherlands and the UK. In reading, only 1.8% of 15-year-olds in Spain reached the top performers for reading, the lowest percentage in the 30 OECD countries apart from Mexico (0.6%).
Figure 13. Mean Score and Percentage of Top Level 5 Performers in Science, Reading and Mathematics
| Sciencemean score (1) | Readingmean score (2) | Mathematics mean score (3) | |
| Finland | 563 (17.0%) | 547 (16.7%) | 548 (18.1%) |
| France | 495 (7.2%) | 488 (7.3%) | 496 (9.9%) |
| Germany | 516 (10.0%) | 495 (9.9%) | 504 (11.0%) |
| Italy | 475 (4.2%) | 469 (5.2%) | 462 (5.0%) |
| Poland | 498 (6.1%) | 508 (11.6%) | 495 (8.6%) |
| Spain | 488 (4.5%) | 461 (1.8%) | 480 (6.1%) |
| UK | 515 (10.9%) | 495 (9.0%) | 495 (8.7%) |
| OECD average | 500 (7.7%) | 492 (8.6%) | 498 (10.0%) |
(1) Level 5 top performers: from 633.33 to 707.93 points.
(2) Level 5 top performers: above 625.61 points.
(3) Level 5 top performers: from 606.99 to 669.30 points. The respective percentages for level 5 top performers for each country are in brackets.
Source: High Performers in Science in PISA 2006, OECD.
Ángel Gabilondo, the Education Minister, has suggested that Spain’s school leaving age should be raised from 16 to 18 as a way to reduce the country’s very high early school-leaver rate, which at 31% is double the EU-27’s average (see Figure 14). The EU countries where 18 is the legal school leaving age are Belgium, the Netherlands, Germany, Poland and Hungary. The UK is considering introducing the change by 2013. All of these countries have substantially lower rates of early school leavers than Spain.
Figure 14. Early School Leaving Rates in Selected EU Countries (% of population aged 18-24)
| Country | Rate (%) |
| Portugal | 36.3 |
| Spain | 31.0 |
| Italy | 19.3 |
| EU-27 | 14.8 |
| France | 12.7 |
| Germany | 12.7 |
| Finland | 7.0 |
| Poland | 5.0 |
Source: Eurostat.
It is well known that young people who leave education withoutrecognised qualifications are at a disadvantage in the labour market and are at increased risk of poverty and social exclusion. This is borne out by the latest figures which show that employment among Spain’s low-qualified workers dropped by more than 11% between March 2008 and March 2009 compared with an EU-27 average fall of only 5% (see Figure 15).
Figure 15. Changes in Employment by Education Levels
| Low qualified | Medium qualified | Highly qualified | |
| France | -3.1 | -2.6 | 5.1 |
| Germany | -2.3 | -1.2 | 5.9 |
| Italy | -4.6 | 0.3 | 0.2 |
| Spain | -11.6 | -5.9 | -2.6 |
| UK | -6.9 | -4.2 | 3.3 |
| EU-27 | -4.9 | -2.6 | 3.0 |
Source: Eurostat.
At the higher education level, Spain has more universities (77, 50 of them state) than other countries with a similar size population, but only 11 of them are classified among the world’s 500 best. Considerable social prestige is still attached to going to university instead of vocational training, although the job prospects and income earned by the latter are increasingly much better than those of graduates, particularly if their degree is in the arts. Spain, today, has roughly twice as many students at university (1.4 million) than people employed in agriculture, reflecting the phenomenal growth in universities as much as the demise of the farming sector. Spain produces more university graduates as a percentage of its total population than Germany, France and the UK. The cost of going to university in Spain is very low (the fees are estimated to cover less than 12.5% of the cost), regardless of the income level of students’ parents. Around one-third of students drop out, another third finish their degree two years or more later and the rest graduate on time.[8]
This inefficient system continues in the dual and segmented labour market, where young adults, on average better qualified than their parents, tend to have temporary contracts and so their employers are not motivated to provide them with continuous training, while older, often less qualified employees are on permanent contracts whose firing costs are 25% higher than the European average.[9] The result is that many young university graduates are on temporary contracts for which they are over-qualified (and frustrated), as a university degree is not needed, while the vocational system does not produce enough people for these jobs. Moreover, salaries are determined by the previous year’s inflation and not by productivity, as in many countries’ wage bargaining systems, which means there is little incentive to be more productive.
The glowing exception in the weak education system are the three leading business schools, which are in a league of their own and have played a significant role in producing the executives required for the expansion of companies abroad. All three are in the top 10 of the latest ranking of the Financial Times European Business Schools, and two of them are classified higher than in 2008 (see Figure 16). IE Business school is ranked 5th (4th in 2008), Iese 6th (7th in 2008) and Esade 8th (11th in 2008).
Figure 16. The Top 10 Graduate Business Schools in Europe (1)
| Rank 2009 |
| 1. HEC Paris (1st) |
| 2. London Business School (2nd) |
| 3. Insead (3rd) |
| 4. IMD (4th) |
| 5. IE Business School (4th) |
| 6. Iese Business School (7th) |
| 7. Rotterdam School of Management, Erasmus University (8th) |
| 8. EM Lyon Business School |
| 8. Esade Business School (11th) |
| 10. Vlerick Leuven Gent Management School (10th) |
(1) Out of 70; 2008 rank in brackets.
Source: Financial Times.
Innovation
The famous comment by the philosopher Miguel de Unamuno (1864-1936), ‘Let them invent! The electric bulb illuminates here as much as where it was invented’, has haunted many governments in Spain, a country which has long lagged behind in R&D expenditure. Spain’s R&D spending represents 1.35% of GDP compared with an EU-27 average of 1.9% and way below the best countries (see Figure 17). Spaniards spend much more on gambling and lotteries every year than on R&D. Spending on R&D has been rising at a quicker pace in the last few years than many other countries, as it needs to do, but the government’s target of 2% by 2010, under the Ingenio Plan, will not be met.
Figure 17. R&D Spending (% of GDP), Selected EU Countries
| % of GDP 1999 | % of GDP 2008 (1) | |
| Finland | 3.16 | 3.72 |
| Germany | 2.40 | 2.63 |
| France | 2.16 | 2.02 |
| EU-27 | 1.83 | 1.90 |
| UK | 1.82 | 1.88 |
| Netherlands | 1.96 | 1.63 |
| Czech Republic | 1.14 | 1.47 |
| Spain | 0.86 | 1.35 |
| Italy | 1.02 | 1.18 |
| Hungary | 0.67 | 1.00 |
(1) 2008 estimates or provisional figures.
Source: Eurostat.
The country also has a very low number of patents per one million inhabitants, as registered with the European Office of Patents. On the basis of the trend between 1995 and 2005, a relatively dynamic period, Spain would reach the UK’s current level in 100 years, France’s in 150 years and Germany’s in 300 years.[10] Spain is ranked very low in innovation rankings: 39th in that of the World Economic Forum (see Figure 18) and 16th out of 17 countries in that by the German Institute for Economic Research (see Figure 19). The rankings are based on indicators such as the quality of education and vocational training and the level of R&D. It is striking that the last Spaniard to win a Nobel Prize for science was Severo Ochoa in 1959, although by then he was an American citizen after working for many years in the US. Before him, it was Santiago Ramón y Cajal in 1906. According to the latest figures from Eurostat, Spanish companies are ranked last in the league table of launching new products. Overall, 18% of companies launched new products in 2006 compared with an EU-27 average of 32.4% and way below the leaders (see Figure 20).
Figure 18. Innovation Ranking
| 1. US | 8. Germany | 15. Austria |
| 2. Finland | 9. South Korea | 16. France |
| 3. Switzerland | 10. Denmark | 17. UK |
| 4. Japan | 11. Singapore | 18. Iceland |
| 5. Sweden | 12. Netherlands | 19. Norway |
| 6. Israel | 13. Canada | 20. Australia |
| 7. Taiwan | 14. Belgium | 39. Spain |
Source: World Economic Forum, Global Competitiveness Report, 2008-09.
Figure 19. Innovation Capacity of the Leading Industrialised Nations (1)
| Country ranking | Score | Country ranking | Score |
| 1. US | 7.00 | 10. UK | 4.78 |
| 2. Switzerland | 6.93 | 11. South Korea | 4.47 |
| 3. Sweden | 6.76 | 12. France | 4.25 |
| 4. Finland | 6.26 | 13. Austria | 4.15 |
| 5. Denmark | 6.14 | 14. Belgium | 4.14 |
| 6. Canada | 5.24 | 15. Ireland | 3.77 |
| 7. Japan | 5.22 | 16. Spain | 1.79 |
| 8. Netherlands | 5.03 | 17. Italy | 1.00 |
| 9. Germany | 5.01 |
(1) The highest score is seven and the lowest one.
Source: German Institute for Economic Research.
Figure 20. Companies that Launched New Products (%) (1)
| Total companies | With 10-49 workers | With 50-249 workers | With more than 250 workers | |
| Finland | 44.6 | 44.3 | 40.7 | 58.0 |
| Germany | 30.4 | 25.9 | 35.3 | 47.7 |
| Italy | 29.5 | 26.8 | 37.2 | 50.1 |
| Poland | 32.7 | 33.1 | 30.6 | 37.5 |
| Spain | 18.3 | 14.8 | 26.0 | 39.5 |
| Sweden | 51.3 | 49.3 | 55.8 | 58.3 |
| UK | 31.6 | 31.0 | 31.7 | 39.8 |
| EU-27 |
(1) Figures for 2006.
Source: Eurostat Yearbook, 2009.
The second government of José Luis Rodríguez Zapatero, which took office in April 2008, established a Ministry of Science and Innovation which extracted science from under the purview of the Education Ministry, but its budget for 2010 reduces non-financial spending by 8.7%, to the horror of the scientific community. In a hard-hitting editorial, Nature, the international weekly magazine of science, said instead of using the recession to stall plans to boost scientific enterprise, the government should be following the example of Germany and France, also recession hit, and cut back public expenditure everywhere except research and education. In Spain’s case, this is more necessary than in these two countries because, unlike them, it has a more pressing need to change its economic model.[11]
Exports
Domestic, as opposed to external, demand has long been the driving force of the Spanish economy and, in particular, the construction sector. It has played a greater role in GDP growth than in the other large EU countries in the years when the economy was expanding and, consequently, its contribution was more negative during years of recession or low growth (see Figure 21).
Figure 21. Contribution to GDP Growth of Domestic Demand (annual percentage change) (1)
| 1992-2005 | 2006 | 2007 | 2008 | 2009 | 2010 | 2011 | |
| France | 1.9 | 2.5 | 3.1 | 1.0 | -0.6 | 0.4 | 1.2 |
| Germany | 1.2 | 2.3 | 1.0 | 1.2 | -0.9 | 0.6 | 1.4 |
| Italy | 1.2 | 1.5 | 1.3 | -1.0 | -3.2 | 0.6 | 1.3 |
| Spain | 3.4 | 5.1 | 4.5 | -0.7 | -6.6 | -1.9 | 0.7 |
| UK | 3.1 | 2.4 | 3.0 | 0.5 | -4.3 | -0.4 | 1.0 |
(1) Forecasts for 2009-11.
Source: European Economic Forecast, Autumn 2009, European Commission.
Between 1988 and 2009, the contribution of external demand to GDP growth was positive in only six years and its largest contribution was in 1993, when Spain suffered its last recession and companies were forced to sell abroad to offset the contraction in their home market (see Figure 22).[12] The second-best year was 2009. Although the recession was much deeper last year, the contribution of external demand was lower than in 1993. Buoyant domestic demand, which sucked in imports, and the traditionally low level of exports were major factors in pushing up the current account deficit to 9.5% of GDP in 2008 (the trade deficit was 7.9%) compared with Italy’s deficit of 3%, France’s 2.3%, the UK’s 1.6% and Germany’s surplus of 6.5%. The trade deficit for the 12 months to September was 5.3% of GDP, significantly lower than the record high of 9.7% in the first quarter of 2008. Nevertheless, it is still very high and its decline was due more to plummeting imports (-22%) than to export growth. The contribution of external demand to quarter-on-quarter GDP growth was zero in the third quarter of 2009 after six consecutive quarters of positive contribution. ‘The scant confidence in the possibility that the international recovery gains strength during 2010, coupled with the cumulated loss of competitiveness of the Spanish economy, gives little room for optimism on exports’, the Institute of Economic Studies commented.
Figure 22. Contribution of Domestic and External Demand to GDP Growth (annual % change)
| GDP Growth | Domestic Demand | External Demand | |
| 1988 | 5.2 | 7.1 | -1.9 |
| 1990 | 3.7 | 5.0 | -1.3 |
| 1993 | -1.2 | -4.5 | 3.4 |
| 1997 | 3.9 | 3.4 | 0.5 |
| 2000 | 5.0 | 5.4 | -0.4 |
| 2001 | 3.6 | 3.9 | -0.3 |
| 2002 | 2.7 | 3.3 | -0.6 |
| 2003 | 3.1 | 3.9 | -0.8 |
| 2004 | 3.3 | 4.9 | -1.6 |
| 2005 | 3.6 | 5.3 | -1.6 |
| 2006 | 4.0 | 5.5 | -1.5 |
| 2007 | 3.6 | 4.4 | -0.8 |
| 2008 | 0.9 | -0.5 | 1.4 |
| 2009E | -3.6 | -6.4 | 2.8 |
Note: Differences are due to rounding.
Source: National Statistics Office (INE) and Analistas Financieros Internacionales (Afi).
Given that Spain’s economic model has run out of steam and domestic demand will no longer be such a strong driver, the engine of future growth has to come, to a greater extent than in the past, from exports. Spanish companies, with notable exceptions, however, became too accustomed to a booming domestic market and tended to sell abroad only when there was no other option and not as something consistent.
Spain’s exports and imports of goods and services in 2008 represented 58.9% of GDP, according to the European Commission one, making its economy more open than Italy’s and France’s (58.1% and 55.3%, respectively) and only slightly less than the UK’s (60.9%), but well below Germany’s (88.3%). Of the five big EU economies, however, Spain’s exports are the lowest in GDP terms (26.5%) and its imports (32.4%) the second-largest by this yardstick after Germany: hence its large trade deficits. Another indicator of the low level of Spain’s exports is their amount in per capita terms (see Figure 23).
Figure 23. Goods Exports per Head (US$)
| Country | Country | ||
| Singapore | 59,854 | Italy | 8,330 |
| Hong Kong | 49,911 | Korea | 7,739 |
| Netherlands | 34,453 | UK | 7,177 |
| Switzerland | 21,507 | Australia | 6,729 |
| Sweden | 18,786 | Malaysia | 6,526 |
| Germany | 16,175 | Japan | 5,568 |
| France | 8,925 | Spain | 5,355 |
Source: based on World Bank figures of exports and population for 2007.
Spain’s share of world merchandise exports was 1.7% in 2008 and of services 3.9%, according to the World Trade Organisation, while its share of global GDP, in purchasing power parity terms, was 2.8%, according to Goldman Sachs. The EU took 69.3% of Spain’s exports in the first nine months of 2009 compared with 73.9% in the whole of 2004 (see Figure 24). Diversification away from the EU, however, was hindered in 2009 by the strength of the euro. In the third quarter of 2009, exports to euro countries fell by 12.8%, almost 10 percentage points less than the fall in exports to other countries.
Figure 24. Geographical Distribution of Spain’s Exports (% of the total) (1)
| Area | % |
| EU | 69.3 |
| Euro area | 57.1 |
| Other countries | 30.7 |
| Russia | 0.9 |
| US | 3.8 |
| Japan | 0.8 |
| Latin America | 4.9 |
| OPEC | 4.1 |
| Rest | 16.3 |
(1) First nine months of 2009.
Source: Department of Customs and La Caixa.
Consumer goods are the main product group in the structure of Spain’s exports (see Figure 25). The technological content of exports is mainly medium or low. High-tech exports only account for 5% of manufactured exports, one of the lowest levels in the EU, according to the latest comparative figures (see Figure 26).
Figure 25. Product Structure of Spain’s Exports (% of the total) (1)
| Product | % |
| Energy | 4.3 |
| Consumer goods | 40.1 |
| Food | 13.5 |
| Non-food | 26.6 |
| Capital goods | 8.3 |
| Non-energy intermediate goods | 47.3 |
(1) First nine months of 2009.
Source: Department of Customs and La Caixa.
Figure 26. High-technology Products (% of manufactured exports) (1)
| Country | % of manufactured exports |
| Hungary | 25 |
| Finland | 21 |
| UK | 19 |
| France | 19 |
| Sweden | 16 |
| Germany | 14 |
| Italy | 7 |
| Spain | 5 |
| Poland | 4 |
(1) 2007.
Source: World Development Indicators 2009, World Bank.
A significant proportion of exports are in the hands of foreign multinationals, particularly the automotive (in a good year close to 20% of exports), steel, chemical and pharmaceutical sectors. These companies are vulnerable to decisions made outside Spain if the competitive advantages that brought them to the country in the first place change for the worse.
There is a clear link between internationalisation (ie, exports and a country’s direct investment abroad) and job creation. Empirical evidence shows that the higher the volume of a company’s exports the more jobs it can and needs to create and the better placed it is to weather a downturn in its domestic market. The same goes for direct investment abroad, as we shall see in the section below on Spain’s multinationals.
The Spain Brand
In the increasingly globalised world, in which price is not always the overriding factor, a brand, an intangible asset, is increasingly the way companies and countries compete. The better known a country’s brand, the easier it is for a country and its products and services of its companies and banks to enjoy success, particularly among first-time buyers, as this hinges, to a varying degree, on the prior image consumers have of the nation that produces them.
Spain is ranked 10th out of 50 countries in the latest Anholt-Gfk Roper Nations Brand Index (NBI) (see Figure 27), up from 11th a year earlier. The NBI is based on six elements –exports, governance, immigration and investment, culture and heritage, people, and tourism– and is the only analytical ranking of the world’s nation brands. In governance the country is ranked 15th, its lowest position, and in exports, which measures the tendency of consumers to actively seek out or avoid products from each country (the country of origin effect), Spain is ranked 12th. Its highest position is 3rd in the tourism ranking, as one would expect, and in culture it is sixth.
Figure 27. Rankings in the Anholt-Gfk Roper Nations Brand Index, Top 20
| Overall | Exports | Tourism | Culture | Governance |
| 1.US | 1. Japan | 1. Italy | 1. France | 1. Canada |
| 2. France | 2. US | 2. France | 2. Italy | 2. Switzerland |
| 3. Germany | 3. Germany | 3. Spain | 3. US | 3. Sweden |
| 4. UK | 4. UK | 4. US | 4. UK | 4. Germany |
| 5. Japan | 5. France | 5. UK | 5. Germany | 5. Australia |
| 6. Italy | 6. Switzerland | 6. Australia | 6. Spain | 6. France |
| 7. Canada | 7. Canada | 7. Canada | 7. China | 7. UK |
| 8. Switzerland | 8. Italy | 8. Japan | 8. Japan | 8. Netherlands |
| 9. Australia | 9. Sweden | 8. Germany | 9. Russia | 9. Denmark |
| 10. Spain | 10. Australia | 10. Egypt | 10. Brazil | 10. Finland |
| 10. Sweden | 11. Netherlands | 11. Switzerland | 11. Australia | 11. New Zealand |
| 12. Netherlands | 12. Spain | 12. Brazil | 12. Canada | 12. Austria |
| 13. Austria | 13. Russia | 13. Scotlandl | 13. Netherlands | 13. Belgium |
| 14. Scotland | 14. Finland | 14. Sweden | 14. Sweden | 14. Scotland |
| 15. New Zealand | 15. Denmark | 15. Austria | 15. Egypt | 15. Spain |
| 16. Denmark | 16. Austria | 16. New Zealand | 16. Austria | 16. Japan |
| 17. Finland | 17. China | 17. Netherlands | 17. India | 17. Italy |
| 18. Belgium | 18. Belgium | 18. Ireland | 18. Scotland | 18. US |
| 19. Ireland | 19. South Korea | 19. China | 19. Argentina | 19. Ireland |
| 20. Brazil | 20. New Zealand | 20. Mexico | 20 Switzerland | 20. Hungary |
Source: Simon Anholt and GfK Roper, September 2009.
The NBI broadly reflects the generally held perceptions about Spain –a country that scores well in tourism, is welcoming and has a substantial culture and heritage–. The NBI points out that tourism is ‘often the most visibly promoted aspect of a nation’s brand, and tourism assets have a disproportionate effect on a people’s perceptions of the country as a whole’. In Spain’s case, this is particularly so. Tourism plays such a vital role in the Spanish economy (it generates around 10% of GDP and employs roughly one in every 10 people) that it would be unwise to do anything that seriously harmed the country’s image as a Mecca for tourism, and yet Spain is also striving to promote a more ‘serious’ (cold) image in order to help exports and make the country known for other achievements and not just as a fun playground.
Very few countries are viewed as both ‘cold’ (efficient, rigorous and thus serious) and ‘hot’ (creative, passionate and hence not serious) or ‘hard’ and ‘soft’. Germany and the UK are among the ‘cold/hard’ countries and Spain the ‘hot/soft’ ones. France, however, is successful both as a country for tourists (it receives more visitors than Spain) and as an exporter. The NBI rankings bear this out: France is first in the culture ranking, second in tourism and fifth in exports.
A country’s brand image depends on the brands of its companies, as well as on its cultural, social and political leaders. For example, thanks to the stunning success of Nokia, the world’s leading mobile phone supplier, and the Finnish government capitalising on this, the whole of Finland is firmly stamped on the world map as a high-tech and innovative country. Nokia has acted as a locomotive and pulled lesser known Finnish brands with it. Finland, with Nokia, and Spain, with the fashion retailer Zara, both have one company each in the Top 100 global brands drawn up every year byInterbrand (see Figure 28).[13]
Figure 28. Best Global Brands 2009 by Country
| Number in Top 100 | Highest Ranked Company, Brand Value (US$ bn) and Position | |
| US | 51 | Coca-Cola (68.7, 1st) |
| Germany | 11 | Mercedes-Benz (23.8, 12th) |
| France | 8 | Louis Vuitton (21.1, 16th) |
| Japan | 7 | Toyota (31.3, 8th) |
| Switzerland | 5 | Nescafé (13.3 25th) |
| Italy | 4 | Gucci (8.1, 41st) |
| UK | 4 | HSBC (10.5, 32nd) |
| Netherlands | 2 | Philips (8.1, 42nd) |
| South Korea | 2 | Samsung (17.5, 19th) |
| Canada | 2 | Thomson Reuters (8.4, 40th) |
| Sweden | 2 | H&M (15.3, 21st) |
| Finland | 1 | Nokia (34.8, 5th) |
| Spain | 1 | Zara (6.7, 50th) |
Source: Interbrand.
Zara’s success, however, has not enhanced the ‘Made in Spain’ label to the same extent as Nokia for Finland and this is not just because Nokia is a high-tech company. Another important reason is that Zara is not clearly linked with Spain; indeed, the name deliberately sounds Italian so that it can be associated in consumers’ minds with that most fashion-conscious of countries rather than with a nation whose image is still too much associated with stereotypes (bullfighting, siestas and fiestas, etc), although this image is out of sync with the country’s reality.[14] Many Spanish companies avoid direct association with their country and origin and use ‘neutral’ brand names such as Camper, Mango, Smint, Donuts, Fun & Basics, Panda Software, Women’s Secret, Springfield and Panama Jack.
This lack of a clear and unambiguous association with Spain and the desire among some leading companies not to reveal the country of origin is one of the conclusions of a recent comparative analysis of the international image of the Spain brand and Spanish brands by Young and Rubicam (Y&R) for the Association of Well Known Spanish Brands (AMRE) using Y&R’s BrandAsset Valuator. For example, how many UK consumers know that the mobile phone operator O2, Britain’s largest, has been Spanish since it was acquired by Telefónica in 2006? The study is based on the following brands: Zara (fashion), Seat (cars), Iberia (airline), Mango (fashion), Chupa Chups (lollipops), Telefónica (telecoms), Smint (dental candy). Movistar (mobile phone operator), Santander (bank), Camper (shoes), Freixenet (sparkling wine), Repsol (oil and natural gas), BBVA (bank), Real Madrid (football club) and Hola (magazine). The Spain brand is perceived as the closest to Italy and the furthest from the US and the country’s products and services are generally associated with an image of low quality and a lack of innovation, leadership and dynamism.
Spain’s image, however, is not the same throughout the world –it has many faces–. The main features of the country’s ‘DNA’ are sociability, sensuality, glamour and friendliness, setting it apart from the other large EU countries which have a more ‘serious’ image (see Figure 29). Although Spanish brands generally have a low level of national DNA, this does not necessarily mean they have a low association with Spain as this could also signify a lack of sufficient communication of the country’s variables. The challenge, says R&Y, is to find the right balance between passion and sociability and high performance and seriousness.
Figure 29. The Brand DNA of Selected Countries
| Spain | UK | France | Italy | Germany | US |
| Sociable | Reserved | Glamorous | Glamorous | Progressive | Leader |
| Sensual | Upper class | Sensual | Sensual | Tough | Progressive |
| Glamorous | Glamorous | Upper class | Stylish | Reserved | Tough |
| Friendly | Intelligent | Stylish | Sociable | Intelligent | Dynamic |
| Fashionable | Prestigious | Prestigious | Fashionable | Leader | Innovative |
| Leader | Fashionable | Uninhibited | Practical | Prestigious | |
| Distinctive | Intelligent | High performance | High performance | ||
| Stylish |
Source: Y&R.
Santander, the euro zone’s largest bank by market capitalisation and BBVA, Spain’s second biggest bank, are ranked 38th and 55th, respectively, in the BrandZ Top 100, the only ranking based on a brand valuation methodology that is grounded in quantitative customer research and in-depth financial analysis. They respectively moved up 10 and 22 positions in 2009 and are the only Spanish companies in the Top 100 (see Figure 30). The brand value is calculated in three steps. First, the proportion of a company’s earnings generated ‘under the banner of a brand’ is determined. Second, only a portion of these earnings can be considered as being driven by brand equity. This is the ‘brand contribution’ (displayed as an index from 1-5, with 5 the highest). It is the degree to which the brand plays a role in generating earnings. In the final step, the growth potential of these branded earnings is taken into account. The brand momentum is displayed as an index from 1-10 (10 is the highest score).
Figure 30. BrandZ Top 100 Most Valuable Global Brands, Selected Companies
| Brand and ranking | Brand value 2009 (1) | Brand contribution | Brand momentum |
| 1. Google | 100,039 (86,057) | 3 | 3 |
| 2. Microsoft | 76,249 (70,887) | 3 | 8 |
| 4. IBM | 66,622 (55,335) | 3 | 5 |
| 9. Vodafone | 53,727 (36,962) | 3 | 2 |
| 27. Bank of China | 21,192 (19,418) | 2 | N/A |
| 30. HSBC | 19,097 (18,479) | 2 | N/A |
| 38. Santander | 16,035 (14,549) | 2 | N/A |
| 55. BBVA | 12,549 (9,457) | 3 | N/A |
(1) 2008 figure in brackets.
Source: Millward Brown Optimor (including data from BrandZ, Datamonitor and Bloomberg).
Santander (7th) and BBVA (12th) are also in the Top 15 financial institutions by brand value and 8th and 7th, respectively, in the Top 15 ranked by book value as a percentage of market capitalisation (see Figure 31).
Figure 31. Financial Institutions, Top 15 by Brand Value, Selected Companies
| Brand and Rank | Brand value(US$ mn) | Brand value as a % of market capitalisation |
| 1. ICBC | 38,056 | 21 |
| 2. China Construction Bank | 22,811 | 18 |
| 3. Bank of China | 21,192 | 20 |
| 7. Santander | 16,035 | 24 |
| 8. Bank of America | 15,480 | 24 |
| 11. Citi | 14,608 | 33 |
| 12. BBVA | 12,549 | 30 |
| 14. Chase | 10,582 | 9 |
Source: Millward Brown Optimor (including data from BrandZ, Datamonitor and Bloomberg).
Spain’s Image
The progress that Spain has made over the last 35 years, during which it moved to a democracy and a market economy (the world’s ninth-largest in current dollars in 2008 after the US, Japan, China, Germany, the UK, France, Italy and Russia, and probably the eighth in 2009 as a result of the euro’s appreciation), is not generally matched by the perceptions abroad of the country. Surveys continue to show, to a varying extent, that the country is still predominantly perceived as a land of siesta and fiesta (with La Tomatina, the world’s biggest food fight, where about 110,000kg of tomatoes are splatted in a grand battle every year, see Figure 32). This image is fine for the country’s tourism industry (the world’s second-largest in terms of the number of visitors and receipts), but not when it comes to exporting its products and being taken as a serious and effective nation. The branding strategy in tourism has been phenomenally successful. However, ‘To be viewed as a country that is entertaining and generally happy is something positive, but it is not enough’, says Julio Cerviño, an associate professor of marketing at the Carlos III University in Madrid. ‘The ideal thing would be if we managed to be viewed as a country that is entertaining and happy, but also one that is managing large enterprises and leading global brands’. Few developed nations have progressed so much in this relatively short span of time and yet still have a significant gap between how it and its companies are perceived abroad and the country’s business and socioeconomic reality (see Figure 33).
Figure 32. Spain’s Image of Fun

Figure 33. Spain Today: Some Economic and Socioeconomic Realities (1)
| Global Ranking | Description |
| Top 10 | Eighth-largest economy in current dollars, but not a G-8 member |
| Top 20 | Fifteenth in the EIU’s Democracy Index, ahead of the US (18th) |
| Top 5 | Eighth-largest stock of outward direct investment country |
| Top 10 | Seventh-largest stock of inward foreign direct investment |
| Top 15 | 15th in the United Nations’ Human Development Index |
| Top 5 | Fourth-longest life expectancy at birth along with Australia, France and Sweden |
| Top 5 | Second largest tourist destination in terms of visitors and receipts |
| Top 5 | Third largest producer of cars in Europe after Germany and France |
| Top 5 | Number one transportation developer |
| Top 5 | Fourth in development of renewable energy |
| Top 5 | Biggest producer and exporter of olive oil |
| Top 5 | Biggest producer and exporter of sparkling wine (cava) |
| Top 20 | 17th in the Gobal Gender Index. |
(1) The figures are the latest available.
Source: IMF, Economist Intelligence Unit, UN Human Development Report 2009, World Investment Report 2009 (UNCTAD), ANFAC, World Tourism Organisation and World Economic Forum.
This ignorance of the situation was amusingly illustrated when José María Aznar, the former Prime Minister (1996-2004), visited the ranch in Texas of President George W. Bush at a time when Spain was producing around two million cars a year and was the world’s eighth-largest manufacturer. Before seeing Bush, Aznar chatted with one of his close advisors. The conversation went as follows: ‘And what is the chief product exported by Spain?’, the advisor asked. ‘Cars’, replied Aznar. ‘No, I am asking about the number one product that Spain exports’. ‘Cars’, repeated Aznar. ‘No, no, what I want to know is which Spanish product sells most successfully abroad’. ‘Yes, cars, cars’, repeated an exasperated Aznar.[15]
In order to change perceptions, it is necessary to reach some consensus among the main players on how the country should ideally be viewed and then work toward it on a coordinated basis. If Spain were a car and not a country, how would its manufacturer sell it? South Korea’s Hyundai, for example, is successful in selling their cars on the basis of price alone, while Japan’s Toyota and Honda have achieved success on the basis of quality/price and Sweden’s Volvo has built up its reputation by emphasising safety. Selling a car, in Spain’s case, on the basis of it being simpático (congenial, pleasant) is not sufficient.
Spain requires a coordinated and well-defined effort of the key stakeholders involved in branding a nation and where possible the maximum consensus, but not at the cost of diluting the appropriate message to be put across. An important issue here is the role that Spain’s 17 autonomous regions would play, particularly the most ‘nationalistic’ ones –the Basque Country and Catalonia– which prefer to go their own way.
Spain could also do with a larger foreign service to promote its interests; the country has around 1,000 diplomats compared with the UK’s 4,000, far fewer, proportionately, as Spain’s population is three-quarters that of the UK and its GDP around two-thirds.[16] Other means can also be used to try to neutralise negative stereotypes. Rodríguez Zapatero announced in July 2008 the creation of a Public Diplomacy Commission (PDC), along the lines of those in other countries such as the UK, but it has still not got off the ground. One reason is budgetary restrictions; they will last a considerable time and so the PDC is unlikely to see the light of day during this government’s life.[17]
Spain’s multinationals
Remarkably, these shortcomings have not prevented Spain from building up a hard core of multinationals. Anyone who had predicted less than a decade ago that Spanish companies today would own the largest mobile telephone company (02) in the UK, operate three lines of the London underground and own several of the country’s largest airports, or that its two largest banks would dominate the Latin American banking scene and Inditex would become the world’s second-largest fashion retailer by number of shops would have been laughed at for making an absurd joke. But this is precisely what has happened, and it is only a small part of the overall picture. Yet Spain’s corporate sector is not generally known for its striding of the globe, the most important structural change in the economy of the last 30 years (see Figure 34). Italian companies are much better known abroad than Spanish ones –many people can name a couple of them when asked to– although Spain has a much larger outward stock of direct investment. The outward investment stock was US$601.8 billion at the end of 2008, 37.5% of GDP (see Figure 35). In GDP terms, the outward investment stock was 12 times higher than in 1990 and the highest among the biggest EU economies.
Figure 34. The Spanish Multinationals with the Largest Global Market Positions
| Company | Industry | Global Market Position |
| Ebro Puleva | Food processing | #1 producer of rice, and 2nd of pasta |
| Grupo SOS | Food processing | #1 producer of olive oil |
| Chupa Chups | Food processing | #1 producer of lollipops and #2 of candy |
| Viscofán | Food processing | #1 producer of artificial casings for the meat industry |
| Freixenet | Sparkling wine | #1 producer of sparkling wine |
| Tavex | Textiles | #1 producer of denim |
| Zara | Clothing | #2 most valuable clothing brand |
| Pronovias | Clothing | #1 maker of bridal wear |
| Acerinox | Steel | #3 producer of stainless steel |
| Repsol-Gas Natural (1) | Gas | #3 distributor of natural gas |
| Roca | Sanitary equipment | #1 maker of sanitary equipment |
| Grupo Antolín | Automobile components | #1 producer of interior linings |
| Zanini | Automobile components | #1 producer of wheel trims |
| Gamesa | Machinery | #3 manufacturer of wind turbines |
| Indo | Optical equipment | #3 manufacturer of lenses |
| Mondragón | Diversified | #1 worker-owned cooperative group |
| Grupo Ferrovial | Infrastructure | #1 developer & manager of transport infrastructure |
| ACS | Infrastructure | #1 private infrastructure management company |
| Acciona | Infrastructure | #1 developer of wind farms |
| Iberdrola | Electricity | #1 operator of wind farms |
| Telefónica | Telecom | #3 telecom operator by total customers |
| Santander | Banking | #4 bank by market capitalisation |
| Prosegur | Security | #3 company by sales |
| Sol Meliá | Hotels | #1 resort hotel chain by number of beds |
| Real Madrid | Sports | #1 football club by revenue |
(1) Joint venture between Repsol YPF and Gas Natural.
Source: prepared by Mauro Guillén on the basis of information at the end of 2008.
Figure 35. Outward Stock of Direct Investment 2008, Selected EU Countries (% of GDP)
| Spain UK | UK | France | Germany | Italy |
| 39.6 | 36.9 | 34.7 | 19.2 | 14.9 |
Source: World Investment Report 2009, UNCTAD.
Thirteen Spanish companies made it into the 2009 FT Global 500 ranking of the world’s biggest companies (see Figure 36). Spain has the 10th largest number of companies in the ranking, three more than Italy but 10 fewer than France (see Figure 37).
Figure 36. Spanish Companies in the FT Global 500 Ranking (US$ million)
| Company and rank (1) | Market value | Net income | Total assets | Sector |
| 32 (35). Telefónica | 93,828 | 9,983 | 131,357 | Telecoms |
| 62. (40) Santander | 56,198 | 11,671 | 1,380,206 | Banks |
| 111. (83) Iberdrola | 35,067 | 3,761 | 112,870 | Electricity |
| 132. (78) BBVA | 30,404 | 6,601 | 713,553 | Banks |
| 180. (244) Inditex | 24,290 | 1,648 | 10,225 | General retailers |
| 203. (460) U. Fenosa | 9,453 | 1,570 | 25,442 | Electricity |
| 213. (193) Repsol YPF | 21,121 | 3,564 | 64,996 | Oil & gas producers |
| 282. (306) Iberdola Ren. | 17,498 | 513 | 26,583 | Electricity |
| 354. (471) ACS | 13,911 | 2,373 | 67,585 | Construction |
| 413. (324) Gas Natural | 12,235 | 1,389 | 24,674 | Gas, water, utilities |
| 445. (300) Cepsa | 11,276 | 361 | 12,690 | Oil & gas producers |
| 458. (399) Criteria Caixa | 10,849 | 1,392 | 57,201 | Financial services |
| 480. (448) Abertis | 10,475 | 812 | 29,219 | Industrial transportation |
(1) 2008 ranking in brackets.
Source: Financial Times.
Figure 37. FT Global 500 2009, Market Value by Country
| Country | Number of companies | Market value (US$ mn) |
| US | 181 | 6,154,034 |
| China | 27 | 1,367,880 |
| UK | 32 | 1,160,225 |
| Japan | 49 | 1,110,743 |
| France | 23 | 796,714 |
| Germany | 20 | 617,515 |
| Canada | 27 | 526,459 |
| Switzerland | 10 | 515,635 |
| Hong Kong | 16 | 439,192 |
| Spain | 13 | 359,000 |
Source: Financial Times.
The expansion abroad has enabled corporate Spain, in general, to weather the global recession much better than had companies relied solely on their home market. This is particularly true of the infrastructure sector and the big commercial banks, Santander and BBVA. The decline in the revenues of Spain’s large construction companies and the number of jobs shed at home would have been much greater in 2009 had these companies not won business abroad (see Figure 38). For example, a consortium led by FCC won the second largest contract to widen the Panama Canal. Seven Spanish companies are in the top 10 transport developers (see Figure 39).
Figure 38. FT Global 500 2009, Market Value by Country (million euros)
| Spain | Abroad total | EU | OECD | Rest | |
| Abengoa | 514.7 | 1,299.3 | 212.7 | 529.1 | 557.6 |
| Acciona | 2,256.5 | 674.9 | 423.9 | 178.7 | 72.3 |
| ACS | 6,330.0 | 1,792.1 | 448.3 | 593.4 | 750.3 |
| FCC | 3,418.3 | 2,592.9 | 2,046.6 | 203.2 | 343.1 |
| Ferrovial | 2,191.1 | 3,710.3 | 2,898.3 | 575.1 | 519.0 |
| OHL | 15,583.9 | 11,164.8 | 6,279.8 | 2,405.9 | 2,479.1 |
Source: National Securities Market Commission (CNMV), first half of 2009.
Figure 39. Top Transport Developers
| Const./Operating (1) | Active Proposals | |
| 1. ACS/Iridium (Spain) | 58 | 39 |
| 2. Global Via (FCC-Caja Madrid) (Spain) | 41 | 27 |
| 3. Ferrovial/Cintra (Spain) | 41 | 8 |
| 4. Abertis (Spain) | 39 | 12 |
| 5. Vinci/Cofiroute (France) | 33 | 17 |
| 6. Macquarie group (Australia) | 33 | 13 |
| 7. OHL (Spain) | 28 | 17 |
| 8. NWS Holdings (China) | 26 | 2 |
| 9. Sacyr (Spain) | 23 | 30 |
| 10. Acciona/Nesco (Spain) | 22 | 11 |
(1) Road, bridge, tunnel, rail, airport concessions; over $50 million in capital put under construction/operation from 1 January 1985 to 1 October 2009.
Source: Public Works Financing.
In the case of the banks, Santander generated 35% of its net attributable profit in the first nine months of 2009 in Latin America (mainly in Brazil) and 16% of it in the UK, while Mexico, alone, provided close to one-quarter of BBVA’s profit. Both banks’ profits stood out in the depressed global banking scene: Santander’s profit for the period was only 2.8% lower at €6.74 billion and BBVA’s slid 3.3% to €4.18 billion. Both figures exclude one-off items. The Banker magazine named Santander the world’s best bank in 2009.
It was largely thanks to the continued healthy profits of Spain’s leading multinationals that the Ibex-35, the benchmark index of the Spanish stock exchange, outperformed (by up to 8 pp) Europe’s main markets in 2009 (see Figure 40). The combined market capitalisations of Santander, BBVA, Iberdrola, Repsol and Telefónica have a weighting of around 70% in the Ibex-35. This index, however, is not representative of all listed companies nor does it reflect the state of the economy as a whole.
Figure 40. Stock Market Indices, 2009 (% rise)
| Index | |
| Ibex-35 Spain) | 29.8 |
| Dax (Frankfurt) | 23.8 |
| FTSE 100 (London) | 21.7 |
| Euro Stoxx 50 | 21.0 |
| Dow Jones | 20.1 |
| Nikkei (Tokyo) | 19.0 |
Source: Markets.
Most of Spain’s direct investment abroad is concentrated in the EU and Latin America, increasingly in the US and very little in Asia, despite its growing importance in the global economy. Other than BBVA’s 15% stake in China Citic Bank and Telefónica’s 5.3% of the mobile telephone operator China Unicom, Spanish companies have few significant interests in China. Santander and BBVA strengthened their positions in the US in 2009, with the former acquiring full control of Sovereign Bancorp and the latter taking over the distressed Texan bank, Guaranty Financial.
According to UNCTAD’s 2009 World Investment Report, there were 82,000 transnationals in 2008 and they accounted for 10% of world sales, 33% of total exports of goods and services and 3.3% of global jobs. On the basis of Spain’s share of global GDP (2.8%), Spain should have at least 2,296 transnationals of one size or another which operate in several countries (the average is 10). But the country is far from this situation and there is thus considerablemore scope.
Conclusion
Spain has reached a crossroads in its economic development and cannot proceed further along the same path. The short-sightedness of an economic model excessively based on construction has been brutally exposed by the collapse of the property sector. The choice now is between an economy that continues to be based on arms (labour intensive, unskilled) or brains (more knowledge-based and internationalised). In the medium term, the former will create more employment, but as Spain’s recession has shown more clearly than that of any other EU country this is not a lasting solution. No other European country, and probably no other developed nation in the world, has created and then destroyed so many jobs so quickly.
It is empirically proved that internationalised companies create more jobs that are stable and of a higher quality than those doing business solely in their domestic market. These companies are, in general, larger, in order to have sufficient critical mass, and they have to be more productive and competitive in order to survive. But size is not the first and only requirement for successful internationalisation. Many small firms have successfully carved out niches on the basis of their technology or a good business model.
The question then is whether Spain is capable of creating a more internationalised economy. Its chances are slim if there is not a substantial improvement in the education system over the next decade –the time it will take to boost attainment levels and for them to have a positive impact on the economy–. In this respect the political class, in particular, and society as whole has an enormous responsibility. Spain has come a long way in 35 years, but should not resign itself to believing that it can go no further. Standing still is not an option.
William Chislett
Former Financial Times correspondent and author of three books on Spain for the Elcano Royal Institute.
Chislett, William (2007), ‘Spain’s Main Multinationals: An Increasing Force in the Economy’, Elcano Royal Institute, Madrid, www.realinstitutoelcano.org/documentos/WP2007/WP32-2007_Chislett_Spain_Multinationals.pdf.
Chislett, William (2008), Image and Reality: Contemporary Spain, Elcano Royal Institute, Madrid, www.realinstitutoelcano.org/wps/wcm/connect/c2611c004f018b2fb05bf43170baead1/WP45-2008_Chislett_Image-Reality_Contemporary_Spain.pdf?MOD=AJPERES&CACHEID=c2611c004f018b2fb05bf43170baead1.
Chislett, William (2008), Spain: Going Places, Economic, Political and Social Progress, 1975-2008, Telefónica, www.realinstitutoelcano.org/materiales/Spain_Going _Places _Chislett.pdf.
Chislett, William (2008), ‘Spain’s Multinationals: Reaping the Benefits of their Strategies’, Elcano Royal Institute, Madrid, www.realinstitutoelcano.org/wps/wcm/connect/ab273a804f018bd2bf9bff3170baead1/ARI114-2008_Chislett_Spain_Multinationals.pdf?MOD=AJPERES&CACHEID=ab273a804f018bd2bf9bff3170baead1.
Circulo de Empresarios & Wharton, University of Pennsylvania (2009), Yearbook 2009, Internationalisation of Spanish Companies.
Dehesa, Guillermo de la (2009), ‘Internacionalizarse con marca: un objetivo estratégico para la economía española’, Memoria X Aniversario, Foro de Marcas Renombradas Españolas Madrid.
Instituto de Estudios Económicos (2009), El Problema del Sobredeudamiento.
Pérez-Díaz, Víctor (2009), ‘La Ciencia en Medio de la Crisis’, Claves de Razón Práctica, nr 196.
Tortella, Gabriel, & Clara Eugenia Núñez (2009), Para Comprender la Crisis, Gadir.
Young & Rubicam (2009), Marca España y Marcas Españolas, Un Analisis Comparado de Su Imagen Internacional, según Brandasset Valuator.
[1] I am grateful to Fernando Grafe and Valeriano Muñoz for reading this paper and making comments and I thank José Antonio Herce of Analistas Financieros Internacionales (Afi) for his assistance.
[2] See Miguel Boyer, ‘Perspectivas económicas’, El País, 23/X/2009.
[3] A report in 2006 published by the Berlin-based Transparency International (TI) and written by Professor Manuel Villoria of the King Juan Carlos University in Madrid said town halls were becoming riddled with corruption as a result of building projects and an enormous amount of ‘black money’ was involved in the construction business, to the detriment of the tax collection efforts of the Finance Ministry. The total number of politicians at the national, regional and local levels under investigation on corruption charges during 2009 was around 800, according to press reports. Spain was ranked 32nd out of 180 countries in TI’s 2009 corruption perceptions index, down from 28th in 2008. It scored 6.1 (6.5 in 2008) out of 10 compared with 7.1 in 2004, its best-ever result. The closer to 10, the cleaner the country.
[4] A major factor here was the fierce competition between regions and town halls to attract investment in the property sector and create more and more activity.
[5] See Guillermo de la Dehesa (2009).
[6] Most of the €36.5 billion spent on unemployment benefits in 2009 was not tied to recipients having to participate in training courses. The monthly subsidy of €420 introduced last summer for those whose benefits had expired is, however, tightly tied to attending courses. The government estimated that 600,000 people would receive this subsidy. It is understood that less than half of this number (260,000 in November 2009) are receiving it as the rest apparently find it more convenient to continue jobs they have found in the submerged economy.
[7] Early school leaving refers to non-participation in school before reaching the school leaving age or before completing a certain number of years of post-primary education, whichever is later. In the UK, a more specific definition of early school leavers is those who leave the education system without a minimum of five passes in the Leaving Certificate or equivalent qualification.
[8] The defects and imbalances in the education system are very well explained in Guillermo de la Dehesa, ‘Como Modificar la Estructura Productiva Española’, El País, 27/XII/2009.
[9] Reforms in the 1980s addressed the rigidities stemming from the employment protection legislation of the Franco dictatorship by introducing fixed-term contracts with no or low firing costs. Their number soared because employers used them as a way to get round the constraints on firing workers on permanent contracts. The proportion of total employees on temporary contracts reached 35% in 2007 (more than double the EU average) and dropped to 25% in the third quarter of 2009, almost all of it through job losses. These workers have borne the brunt of the massive destruction of jobs in Spain.
[10] These calculations are made by Victor Pérez-Díaz (2009), ‘La Ciencia en Medio de la Crisis, Claves de Razón Práctica, nr 196, October.
[11] ‘In the long-term, industry will be poorly served by a failure to develop and maintain a strong basic-research base’, the editorial said. ‘Spain is ill-advised to wed itself to the simplistic and outdated notion that a country can live on transferring knowledge while running down the knowledge generator’.
[12] The difference between domestic and external demand gives the figure for GDP growth. For example, in 2009 the contribution of domestic demand to GDP growth was 6.4 pp negative and that of external demand was 2.8 pp positive, which meant GDP shrank by 3.6%, according to estimates.
[13] Telefónica and Santander would probably make it into Interbrand’s ranking if they had a significant distribution presence in the three continents of the Americas, Europe and Asia (one of the requirements) but, unlike Zara, they are not spread throughout the world. Their presence is largely in Latin America and Europe. Zara is part of Inditex and its best known brand. At 31 October 2009 Zara had 1,372 stores around the world (including Spain) and Inditex a total of 4,530.
[14] For a fuller explanation, see the author’s Paper, published in 2008, on Spain’s image at www.realinstitutoelcano.org/wps/wcm/connect/c2611c004f018b2fb05bf43170baead1/WP45-2008_Chislett_Image-Reality_Contemporary_Spain.pdf?MOD=AJPERES&CACHEID=c2611c004f018b2fb05bf43170baead1.
[15] Cited in José Luis Barbería, ‘El valor de la “marca” España’, El País, 19/VI/2006.
[16] See Martín Ortega Valcerén, ‘Menos Europa, Más España, Todo Global’, El País, 31/XII/2009.
[17] The author declares an interest here as he has been proposed as a member of the Public Diplomacy Commission in the event that it is ever launched.
