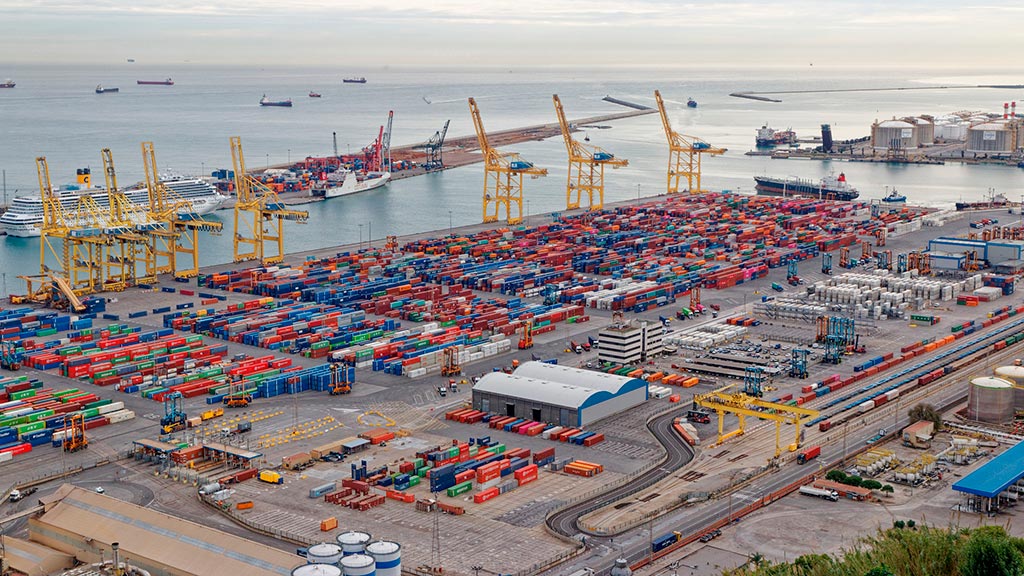
Spain’s merchandise exports, which have played a significant role in the economy’s recovery, set a new record in 2018 for the 10th straight year of €285 billion, but the growth of 2.9% was considerably less than the 7.7% in 2017 (see Figure 1).
Figure 1. Merchandise exports’ value, as a percentage of GDP and coverage, 2009-18 (€ billion and %)
| Exports (€ bn) | % of GDP | Coverage (%) (1) | |
|---|---|---|---|
| 2009 | 159.9 | 15.2 | 77.6 |
| 2010 | 186.8 | 17.7 | 77.8 |
| 2011 | 215.2 | 20.2 | 81.8 |
| 2012 | 226.1 | 21.5 | 87.7 |
| 2013 | 235.8 | 22.8 | 93.4 |
| 2014 | 240.6 | 22.9 | 90.6 |
| 2015 | 249.8 | 23.3 | 90.9 |
| 2016 | 256.3 | 22.8 | 93.6 |
| 2017 | 276.1 | 23.8 | 91.3 |
| 2018 | 286.0 | 23.6 | 89.4 |
(1) Exports as a percentage of imports.
Source: Ministry of Economy and Competitiveness.
The rise in exports was lower than that attained by the euro zone (+4.4%) and the European Union (+4.5%). Growth was also below that of global trade for the first time since 2008. In real terms, exports declined by 0.1%, while imports were up 1.1%.
Spain’s slowdown in exports combined with a 5.6% rise in imports, reflecting the pick up in domestic demand, produced a trade deficit of €33.8 billion, the highest since 2011. Exports in 2018 covered 89.4% of imports, the lowest coverage since 2012.
The contribution of external demand to GDP growth was marginally negative at 0.3 percentage points (positive in 2017 at 1.0 pp).
The decline in the trade deficit over the last 10 years from a peak in 2012 of €53.2 billion, coupled with, among other things, the trade surplus in services (a record 82.6 million tourists in 2018), has moved the current account into the black (the deficit hit 9.3% of GDP in 2008).
Exporting was a path to survival for many companies after the country went into a prolonged recession following the bursting of a massive property bubble in 2008 and the global financial crisis. Faced with plummeting demand from consumers, companies and the government, some companies, particularly small and medium-sized ones, had no alternative but to seek out markets abroad or face going to the wall.
The total number of exporters rose from 137,528 in 2012 to 161,392 in 2018, and regular ones (more than four years continuously) from 38,373 to 51,768 (see Figure 2). Growth in regular exporters during this period (+35%) was almost double that of total exporters (+17%).
Figure 2. Total and regular exporters, 2013-2018
| 2013 | 2014 | 2015 | 2016 | 2017 | 2018 | |
|---|---|---|---|---|---|---|
| Total | 151,160 | 147,845 | 147,334 | 148,658 | 151,454 | 161,392 |
| Regular (1) | 41,168 | 45,842 | 47,768 | 49,767 | 50,568 | 51,768 |
(1) Companies that have exported for four consecutive years.
Source: ICEX.
The main exporting sectors in 2018 were capital goods (20.2% of the total and up 1.1%), food, beverages and tobacco (16.1% of the total and +0-2%), vehicles (15.6% and -1.5%, respectively) and chemical products (14.3% and +5.1%).
Exports to the European Union (65.6% of the total) rose 2.6% compared to 8% in 2017, with those to Germany, the main market, down 0.6% and those to the UK, the fifth largest, falling 0.1%. Those to the whole of Latin America –which still buys considerably less than Portugal– only grew 0.4%, as a result of lower exports to Peru (-12.6%), Argentina (-7.4%) and Brazil (-3.4%). Sales to Africa, however, increased by 5.1%, with those to Egypt and Algeria up 30.1% and 26.6%, respectively.
A very small number of exporters still account for a big share of exports (see Figure 3). The 10 largest exporters accounted for 15.5% of total exports last year, not much higher than in 2010.
Figure 3. Percentage share of the value of Spain’s exports by main exporters
| % of total exports | ||
|---|---|---|
| Main exporters | 2010 | 2018 |
| Top 10 | 14.9 | 15.5 |
| Top 25 | 22.7 | 24.3 |
| Top 100 | 38.0 | 39.7 |
| Top 500 | 57.3 | 58.5 |
| Top 1,000 | 66.6 | 67.5 |
Source: ICEX with customs data.
The export concentration is due to the high atomisation in Spanish companies: their average size is a fraction compared to that of many other developed economies. This limits export capacity as it is widely accepted that firm size is the largest single determinant for companies to start exporting. Larger firms tend to have higher productivity growth, so their unit labour costs typically rise less than for smaller and less productive firms.
As well as the challenge to increase company size, Spain’s specialisation in medium-high technology and medium-low quality exports with high price sensitivity makes exports dependent on cost-competitiveness. This makes Spanish exporters more exposed to competition from emerging economies.
Looking ahead, the bank BBVA forecasts relatively favourable market conditions for Spanish exports this year, in spite of the expected slowdown in global growth, the uncertainty over Brexit and the moderate appreciation of the real effective exchange rate.
Although domestic as opposed to external demand is now the main engine of economic growth, a reversal of the admirable internationalisation of Spanish companies is unlikely as the new exporters over the last decade have gone to considerable lengths and costs to establish a presence in foreign markets, and it is not something easily thrown away or recovered if they do cease to export.


