Theme
If the EU were a single country, its global presence would be almost as large as that of the US.
Summary
The Elcano Global Presence Index calculates the external projection of 100 countries. Their presence is classified in three dimensions: economic, military and soft. The Index also allows for the calculation of the EU’s global presence as if it were a single country. This paper aims to analyse this presence and its evolution from different perspectives. It describes the EU’s role in the world, looking at the development of its presence by different Member States (highlighting the importance of the UK, Germany and France) and, finally, at intra-EU relations. The comparison of the results of the key elements of the extra-EU presence of the entire Union and the intra-EU presence of its Member States shows what could be called the ‘British paradox’: the UK is an important player for extra-EU relations and, for that same reason, has a more discrete intra-EU presence than Germany. In more general terms, this paper shows a significant world presence of the EU in many economic, soft and military fields. This contrasts with the Union’s proactivity in shaping the globalisation process.
Analysis
The Elcano Global Presence Index is a tool for the analysis of international relations. It aims to quantify the external projection of countries (currently 100). Global presence is divided into three dimensions: economic (exports and investments), military (troops deployed and the means for it) and soft presence (science, technology, migration, tourism, culture, sports, information and development cooperation). The Index is calculated for the years 1990, 1995, 2000, 2005 and 2010-16. That is, since 2010 the calculation is carried out annually, thus allowing for revealing transformations in the world order since the end of the Cold War.
The time series shows different global trends that have been analysed in various publications since 2011.1 ‘Old powers’ have tended to lose global presence (in relative and also, in some cases, absolute terms) coinciding with both the period of rapid globalisation (during the 2000s and early 2010s) and the Great Recession, while emerging and developing countries have been massively adhering to the process of globalisation and swiftly gaining global presence. As a result, several emerging countries (particularly in Asia and with an outstanding performance by China) have been gaining positions in the Global Presence Index ranking over the years.
The Index also shows a rapid globalisation since 1990 (and particularly since 2000), followed by a slowing down between 2012 and 2015 and, finally, what could be the beginning of a de-globalisation phase in 2015.2
The Elcano Global Presence Index also allows for the calculation of the EU’s global presence as if it were a single country.3 This paper aims to analyse its presence and its development from different perspectives. First, it describes the EU’s role in the world (its ranking position, quota and contribution to variables/dimensions). Secondly, it looks at the construction of its presence by different Member States (including the variables/dimensions provided by each of them). Finally, in the third and last section, it focuses on intra-EU relations.
The EU in the world
If the EU were a single country, it would rank 2nd in global presence after the US, which is 1st, and be followed by China, Japan and Russia (Graph 1). In 2016 the EU’s index value was 2,320 points and that of the US 2,457. Given the small gap between the two, both have been sharing the two top positions over the 2005-16 period: the EU topped the ranking between 2011 and 2013 and, again, in 2015. It should also be noted that the gap with the 3rd country in the ranking, China, is significant (since the latter had an index value of 689 in 2016). Therefore, most probably, the EU and the US will be maintaining or alternating their positions in the coming years.
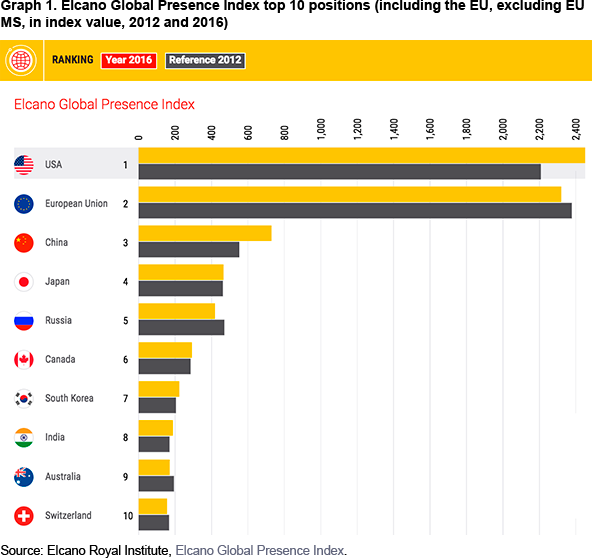
Countries can expand their external projection (therefore increasing their global presence index over the years) and do so at a slower pace than others (therefore reducing their global presence in quotas or relative terms). This is the case of ‘old powers’, Western countries that are still hanging on to the top positions of the ranking (as a result of decades or even centuries of internationalisation), even increasing their global presence in absolute terms (with the exception of the crisis years) but reducing their share of added global presence of all 100 countries (their quota). This pattern is that of the EU as a whole.
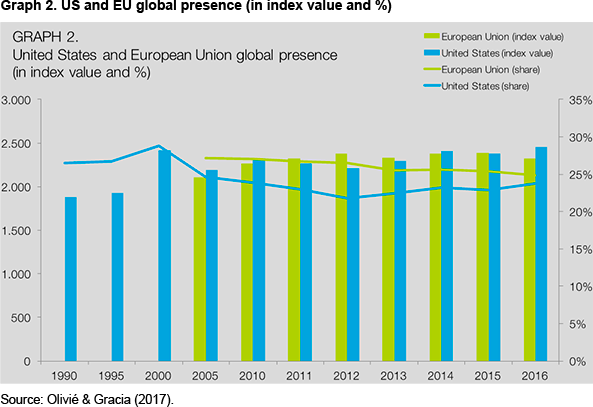
The economic crisis, which has especially hit the EU, has had an impact on its presence. On the one hand, it has led to a drop in international cooperation flows and on the number of immigrants received. On the other, it has slowed down the growth of the economic dimension, although this has been offset by the geographical re-orientation of exports to other regions of the world. Thus, the EU records a loss of global presence in absolute terms. Therefore, its current 2016 record (2,320 points) is at the same level as it was back in 2011 (2,322 points).
In the same vein, the EU has been steadily decreasing its share of total global presence from 27% in 2010 to less than 25% in 2016. It should be noted that the US’s loss of quota is even greater: after a peak of almost 29% of the world’s external projection in 2010, the figure decreased to a minimum of less than 22% in 2010 and then recovered to nearly 24% in 2016 (Graph 2).
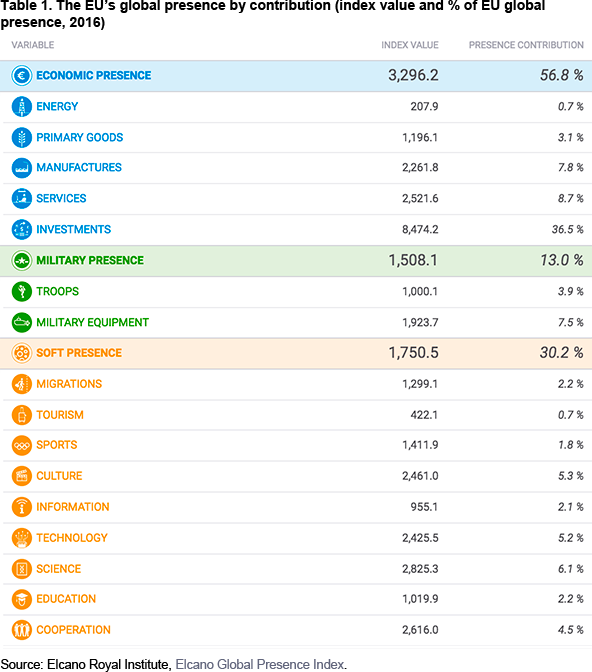
Countries or blocs of countries with high levels of global presence generally have them on the basis of an extended international projection in all fields, that is, in all or numerous global presence variables and dimensions. This is the case of the EU, which has the world’s highest values in the economic (3,296 points in 2016 vs 2,928 for the US) and soft (1,750 points vs 1,745 for the US) dimensions. Only in the military dimension is the US hegemony maintained (1,508 points vs 2,844 for the US).
Therefore, the EU leads globally particularly in the economic dimension. It tops the world ranking in three out of five economic variables: primary goods, services and investments. Given its allowance of natural resources, it is 3rd in energy as it also comes 3rd in manufactures, after the US and China. This leading role also applies to some variables of the soft dimension. The EU projects the highest external projection in tourism, sports, science and development cooperation. The US records a higher global presence in the rest of the soft variables.
Its growing presence since 2005 is based on the economic dimension, in which the euro’s stronger role as an international currency has been a contributory factor. As a result, the economic dimension explains almost 57% of the Union’s global projection, with an outstanding share corresponding to the variable of investments (36.5% of the total). It should be noted that the world or average pattern of external projection shows a slightly lower contribution of the economic dimension (less than 54%) and a significantly lower weight of investments (less than 22%). The outstanding role of investments is partly due to the comparatively higher contraction of other variables as a result of the effects of the Great Recession. This is the only economic variable referring to stocks rather than flows (the other four economic variables indicate countries’ exports) and therefore the less sensitive variable of the five to a changing juncture.
The different soft variable records are more even. However, science, culture and technology are the highest contributors in 2016 (Table 1). Again, when compared to an imaginary ‘world pattern’, these variables stand out as European features with the exception of technology. This variable’s contribution to the average global presence is lower in the EU (5.2% vs 6.5%). The contrary is the case with the other two: culture has a nil contribution to the world’s external projection while science accounts for only 4.3% of the average profile of contributions (6.1% for the EU).
A few Member States build the EU’s global presence
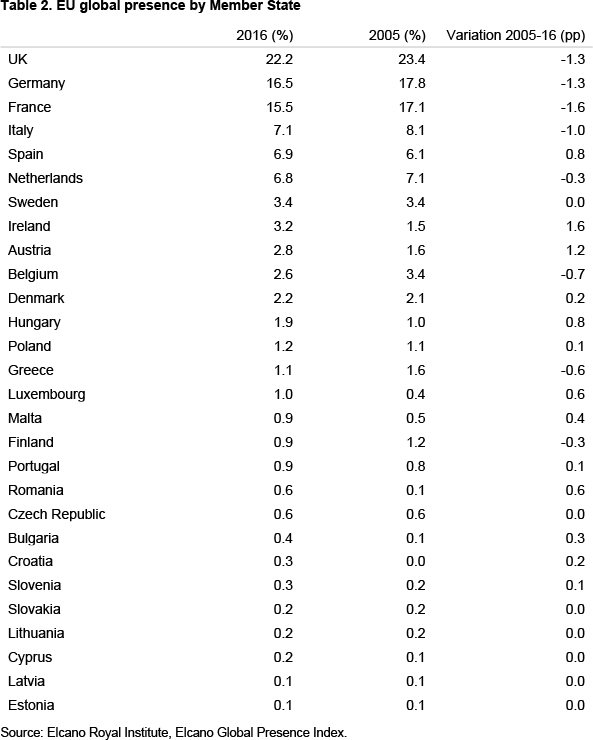
The EU’s global presence can be analysed geographically. It is possible to calculate the extent to which each of the 28 Member States contribute to the total external projection of the whole territory. Data for 2016 show that the UK is the main contributor to European global projection, followed by Germany, France, Italy, Spain and the Netherlands. The three top countries account for over 54% of Europe’s global presence (Table 2). This ranking does not record major changes over the last decade. Actually, the only change among the top six spots is that, since 2005, the Netherlands and Spain have switched their positions.
However, there is a certain (although very timid) de-concentration of such contributions as ‘big’ Member States have slightly lost weight over the past decade. All six, with the exception of Spain, record losses that range from 0.3 to 1.3 percentage points. These losses are offset by increased contributions from Ireland (1.6 additional percentage points between 2005 and 2016), Austria (1.2), Hungary (0.8), Spain (0.8), Luxembourg (0.6) and Romania (0.6).
These figures show what we have called the ‘British paradox’ in previous analyses. The UK is the leading contributor to the EU’s external presence and yet its foreign policy narrative insists on the country’s extra-European links. These two phenomena are actually consistent: British non-European links are precisely an important asset of the EU’s projection outside its borders. For that same reason, another big player with strong intra-European links such as Germany comes only 2nd when defining the EU’s non-European presence.
The importance of the EU’s big three and the economic dimension also show up when the contributions are broken down both by Member State and dimensions or variables. The top three contributions are those of the same three Member States (the UK, Germany and France) in the economic field. These are followed, again, by the UK’s and Germany’s contribution to the EU’s external soft projection. A fourth country, the Netherlands, only appears in sixth place, on account of its economic contribution (Graph 3).
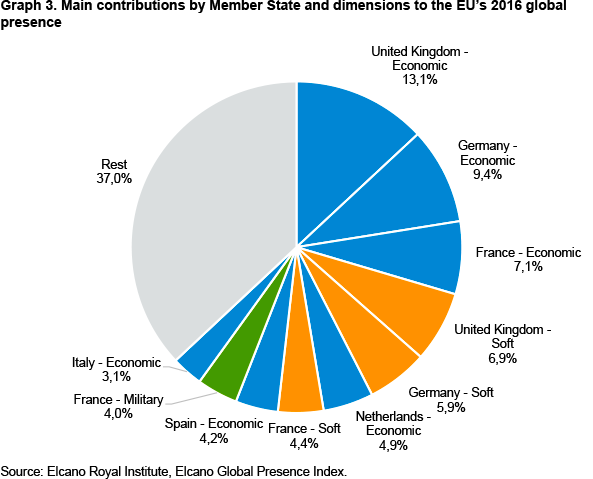
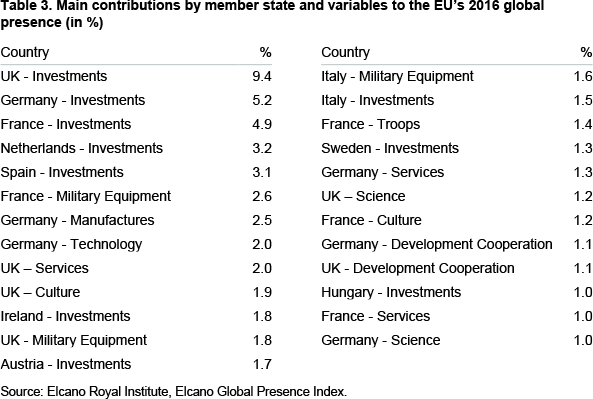
Contributions by Member States and variables reveal the same pattern. The top five individual contributions are those of extra-EU stocks of foreign direct investment of the UK, Germany, France, the Netherlands and Spain. Other important contributions through that same variable are those of Ireland, Austria, Italy, Sweden and Hungary. The first soft contribution appears in eighth place, German technology, which is very much aligned with the same country’s contribution to extra-EU global presence through manufactures (in seventh place). Services also play a significant role (specifically, those of the UK, Germany and France), probably linked to the variables of investment, technology and science. In other words, several forms of global presence reinforce each other. Development cooperation also plays a significant role in Europe’s external projection. However, relevant contributions in this area are limited to those of Germany and the UK (Table 3).
Germany, the UK and France lead the intra-European projection of Member States
The Elcano European Presence Index calculates the internationalisation of the Member States within the perimeter of the Union since 2005 and following the general methodology of the Elcano Global Presence Index.
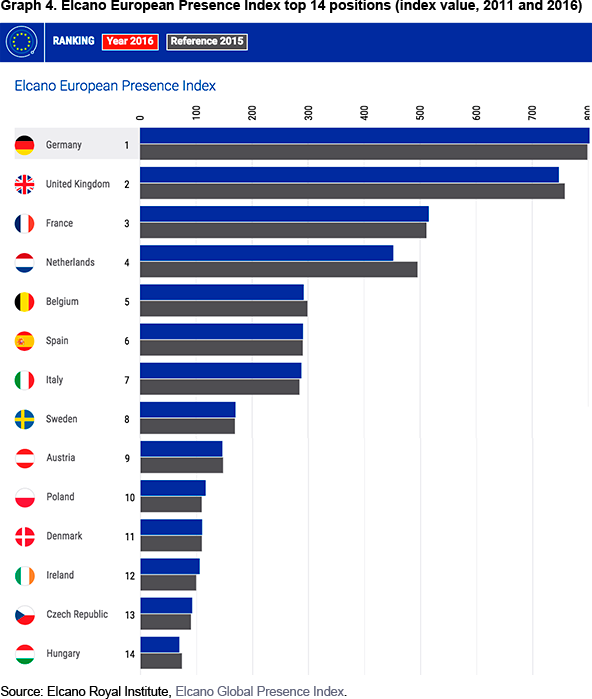
As with the Member States’ contributions to the EU’s global presence, the big three top the ranking. However, and due to what can be defined as the ‘British paradox’, with 804 index value points in 2016, Germany tops the list (as the Member State with the largest projection in the EU sphere), followed closely by the UK (748 points) and, at a certain distance, by France (515 points) (Graph 4). These three countries are followed by the Netherlands, which is in fourth place. As mentioned above, the Netherlands is the sixth-largest contributor to the EU’s external projection. The fact that it is up two positions with respect to the previous ranking shows a certain intra-European profile of external projection, like the German and unlike the British. Indeed, given the strong economic links between the Netherlands and Germany, both countries’ external projections might be strongly interlinked. On the contrary, Spain and Italy are down three and one positions, respectively, with regards to the ranking on contributions, showing a relatively extra-European projection (with respect to other Member States).
Another feature of the Elcano European Presence Index is its low variability. The top seven countries are the same since the beginning of the time series, in 2005. The strength and consistency in the external projection of this group of countries allows for only one minor change among the group and for the 2005-16 period, with Belgium down from fifth to seventh position in 2010 and 2011 and then recovering back to fifth place in 2012. As in any other index (including the Elcano Global Presence Index), variability increases in the lowest positions of the ranking. However, in general terms, and unlike with the Global Presence Index, there have been no tectonic shifts in the group (such as those of Asian countries and, particularly, China).
Conclusions
If the EU were a single country, its global presence would be almost as large as that of the US. Although the Union’s index value has been slightly decreasing (both in absolute and relative terms) since the Great Recession, it is undoubtedly a key actor on the world scene and, therefore, a potential maker and shaper of the globalisation process and global governance. There might be a gap between its presence and the power or influence exerted by the EU in the world order,4 something that could be interpreted as a lack of will to transform the asset or input (global presence) into an outcome or output (global or regional influence). This issue is indeed a key element of the recently published EU Global Strategy5 that calls for a more active role of the Union in global governance.
Once Brexit is completed and the UK exits the EU, the global presence values of both parties will be affected. It is difficult to foresee the direction and magnitude of the impact. The intense EU-UK relations will then (automatically) become part of the EU’s external presence (leading to an increase in the EU’s external presence). However, in parallel, the EU will lose the UK’s contribution to its external presence –the highest among all Member States due to what could be called the British paradox–. As for the UK, its global presence might be affected in many different ways depending on how the country re-shapes its foreign relations with both the EU and the rest of the world as a result of Brexit.
Methodology
The EU’s foreign presence is measured starting in 2005 and considering that its changing composition should be reflected in the Index. Both the Union’s global presence and the Union as the sphere of external projection calculated in the European Presence Index change with every new enlargement. As a result, the Union’s presence corresponds to that of 25 members in 2005, 27 from 2010 to 2012 and 28 since 2013.
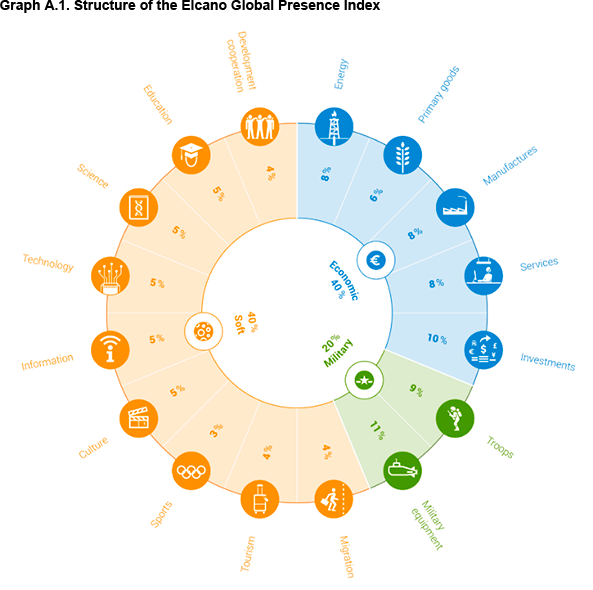
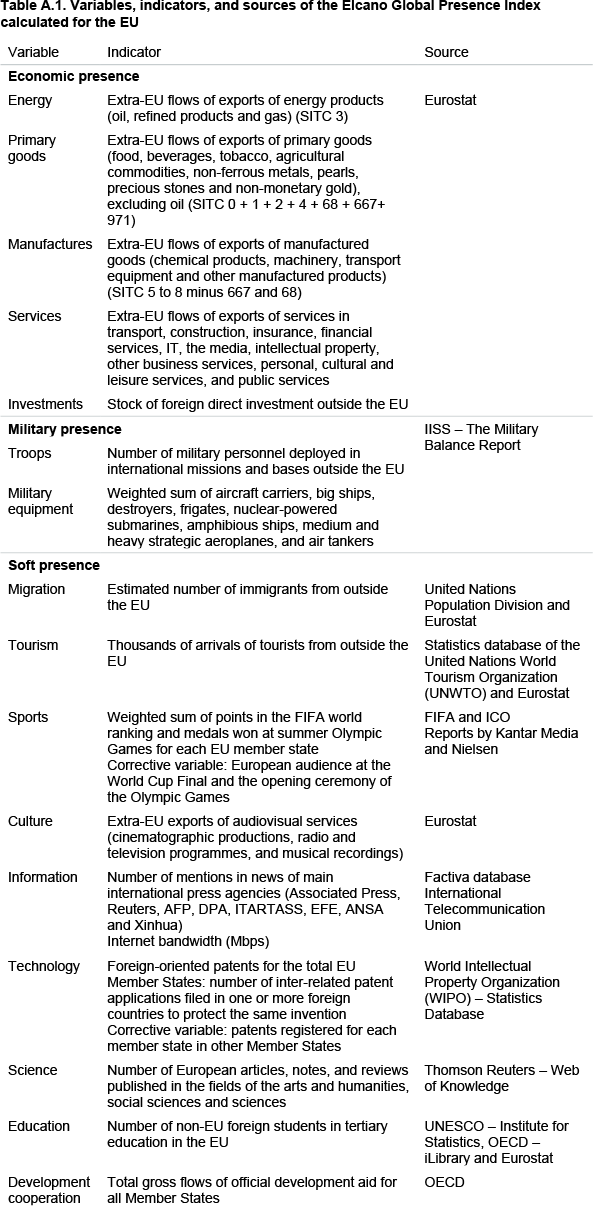
To measure the EU’s presence in the world we maintain the components of the Elcano Global Presence Index (Graph A.1). For each of these components and for every member, the intra-European and extra-European flows must be differentiated, since a mere totalling of their results would be recording their projection in other Member States (ie, consider the intra- and extra-European trade in German goods). This distinction between flows has been made feasible by using additional sources of data, especially Eurostat (Table A.1).
Starting with the 2012 edition we now calculate the presence of the individual Member States within the Union itself: the Elcano European Presence Index.6 To some extent, methodologically, this indicator is the flip-side of the Global Presence Index for the EU. In a similar way to the latter, it shows the cross-border presence of the Member States, which in the case of the Elcano European Presence Index is limited to the European (and not global) space. It facilitates a comparative analysis of the current situation and recent evolution of the positioning of European countries within the Union. It can also provide relevant information on the position of the Member States in the calculation of their European as well as their global presence.
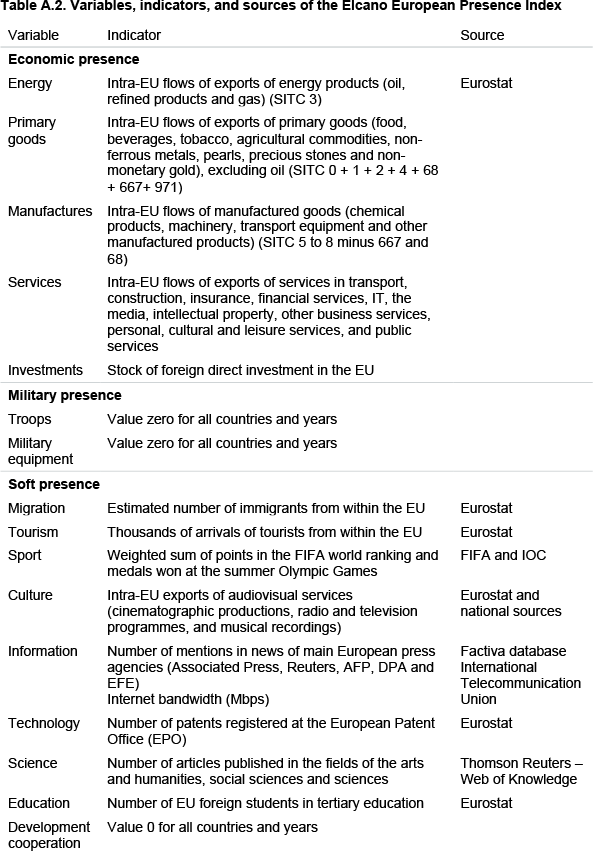
The Elcano European Presence Index aims to be an Elcano Global Presence Index on a European scale, so the structure and methodology of the latter has been respected as far as possible, although some slight modifications have occasionally proved essential (Table A.2). Thus, in general terms, the calculation of European presence modifies the calculation of global presence by reducing the measures of presence on a global scale to the intra-European scale (for example, intra-European migration flows, exports to the rest of the EU or European foreign students). For that reason, three indicators compute a zero value, as they are not part of European countries’ projection inside the EU: troops, military equipment and development cooperation. Moreover, given the indivisibility of some variables, there was no possibility of distinguishing the extra- from the intra-European component, so we stick to the values of global presence and re-scale them considering only the European countries. This is the case of sports, science and information (in its Internet component).
It almost always does so by using Eurostat data, just as for the calculation of the global presence of the EU. Obviously, the change in scale also reduces the scaling: the value of 1,000 assigned to the maximum indicator in the Elcano Global Presence Index is given, in the case of European presence, as the maximum value registered in 2010 by a member state and for the intra-European presence series. Finally, just as in the index for the EU, the reference area for which European presence is measured is the Union as it has been composed at different moments in time, variations being the result of the enlargement process.
1 See, for instance, Iliana Olivié & Manuel Gracia (2017), Elcano Global Presence Report 2017, Elcano Royal Institute.
2 This assessment is based on the evolution of the added value of global presence projected by all 100 countries. See Olivié & Gracia (2017), for more details.
3 This is done by adding the global presence of all Member States and deducting the intra-European presence of each. See Olivié & Gracia (2017) for more details.
4 This relation was explored in Iliana Olivié, Manuel Gracia & Carola García-Calvo (2014), Elcano Global Presence Report 2014, Elcano Royal Institute.
5 European Commission (2016), ‘Shared Vision, Common Action: A Stronger Europe. A Global Strategy for the European Union’s Foreign and Security Policy’, European Commission, June.
6 Results of the Elcano European Presence Index are available at www.globalpresence.realinstitutoelcano.org.


