


Original version in Spanish: España en el mundo: análisis en base al Índice Elcano de Presencia Global 2016
Theme
Spain maintains its 12th position in the Elcano Global Presence Index, although it has lost some measure of global presence in all of its dimensions (as have the other countries of the region).
Summary
Incorporating the latest data from 2016, Spain received a total global presence index value of 204.1. As a result, Spain maintained its 12th position in the classification of 100 countries calculated by the Elcano Global Presence Index. Spain’s strength continues to be the soft dimension (11th), as well as the economic (also 12th place). However, in the military sphere (17th), Spain’s international role is more passive.
The country’s global presence is projected domestically from all of its regions (or Autonomous Communities) and cities, although the leaders tend to be the largest in terms of economic output or population (ie, Madrid, Catalonia and Andalusia).
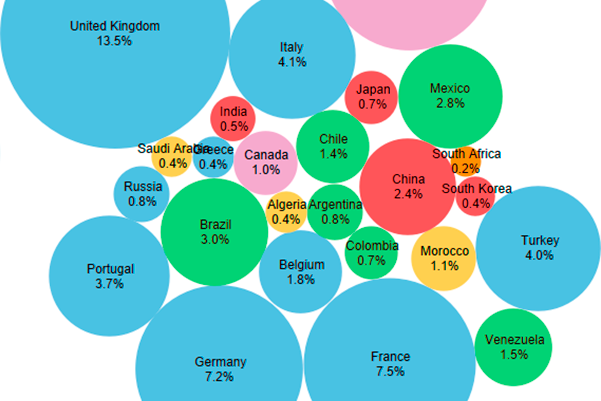
To draw a more precise picture of Spanish international activity that might inform foreign policy decisions, in this paper we calculate for the first time the geographic distribution of Spain’s global presence in the world. The strong concentration of Spain’s presence in Europe (more than 60%) is notable. Within Europe, the UK alone absorbs 13.5%. At the same time, the entire region of Latin America accounts for the same proportion (13.5%) of Spanish global presence. In Asia-Pacific, on the other hand, its presence is fundamentally ‘soft’ (with few economic variables involved).
Analysis
Spain maintains its 12th position in the global presence rankings, but it has lost some global presence in terms of ‘quota’. With an index value calculated at 204.1 in 2016, Spain remains in 12th place among the 100 countries included in the Elcano Global Presence Index. As we have detailed in previous analyses, Spain considerably increased its global presence, relative to other countries, from 1990 to 2016 (the period for which the Index has been calculated), due mainly to the fact that the country rapidly inserted itself into the global economy and international political system during that time. At the beginning of this period, for example, Spain had just joined NATO and was in the process of integrating into the EU.1
")
The new methodology2 used to calculate the Index this year continues to reflect the same characteristics of international projection that we have noted in previous versions of this study. Spain has tended to ‘economise’ its external action, placing it currently in the 12th position within the ranking for global economic presence (the same position it occupies in the overall presence index). However, in terms of military presence Spain falls to 17th place. On the other hand, in the soft dimension of international presence, Spain occupies 11th place.
It can be observed that, to a certain degree, the international projection of Spain after the economic crisis began to show more qualities that were characteristic during the 1990s as opposed to those that defined Spanish presence during the years before the Great Recession. For example, the contribution of the tourism variable, which explained 7.8% of Spanish global presence in 1990, now contributes 5%, more than 1.7 percentage points higher than in 2010. This ‘U’-shaped evolution is also observed in the contribution of commodities (6.9% in 1990, 5.8% in 2010 and 7.7% in 2016). Reflecting the same phenomenon, development cooperation began at 1.8% of Spanish global presence in 1990, reached 3.9% in 2010 and then fell to 1.2% in 2016, a level similar to that found in the 1980s when the country stopped being a recipient of official development aid.
However, the performance of other variables reflects the fact that certain structural changes in the nature of the country’s external projection have not been reversed by the years of crisis. For instance, science, which accounted for 2.3% of total presence in 1990, increased to 4.1% in 2010 and again to 5.9% in 2016. The same thing happened with culture: 3.3% in 1990, 4.6% in 2010 and 6% in 2016.
Although particular high value-added variables (at least potentially) have strengthened in Spain’s global presence over time, this does not mean, however, that the Spanish position has also improved relative to other countries. This can be seen in the ‘quotas’ of global presence –that is, the proportion of the aggregate presence of the 100 countries included in the Index that is projected by a single country, either in overall terms or in one of the particular dimensions or variables (see Graph 2)–. Like most other countries in its region, Spain has been losing global presence quota against the backdrop of the economic crisis in Europe and the US and recurring emergencies in the Global South.3 The loss has occurred in all three ‘dimensions’ of presence (although to different degrees): in the economic (a drop of 1.5 percentage points in the investment variable), military and soft dimensions. Spain’s soft presence has held up more resiliently for Spain than the other two dimensions (despite a sharp drop of 4 points in the development aid variable).

Madrid, Catalonia and Andalusia lead Spain’s global presence
In the same way that Spain’s global presence derives from distinct dimensions of activity (economic, military and soft), it can also be explained by the different international behaviour of the country’s 17 Autonomous Communities (regions) and two Autonomous Cities. There is a strong relationship between the contribution of these Autonomous Regions and Cities to global presence and their contribution to aggregate GDP. As such, it is not surprising that the larger proportions of international presence are projected from the regional communities of larger economic or demographic size: these include, in the following order, Madrid, Catalonia and Andalusia, which together account for 58.8% of Spain’s global presence.
Table 1 shows how, with the new methodology for calculating the Index, some Autonomous Communities continue to show a more ‘extrovert’ profile (when their contribution to aggregate global presence is larger than their contribution to GDP) while others are more ‘introvert’ (when the opposite holds). Particularly extrovert are Cantabria (16th in GDP but 7th it its contribution to global presence), Madrid and Catalonia. In contrast, the most introvert are Castilla-La Mancha (9th in GDP, 13th in global presence), Castilla-Leon, Valencia and Andalusia.

Some communities make a large contribution to Spain’s global presence in specific indicators. This is the case of the Balearic and Canary Islands: both make strong contributions to the tourism variable (as highlighted in this same analysis a year ago). It is also the case of Andalusia and Valencia with respect to commodities and Murcia with energy. Madrid makes the greatest contribution in services, investment, military equipment, troop deployment, culture, technology, education and development aid.4
At the time of writing this paper, internal territorial tensions in Spain were at one of their highest levels in recent history. For this reason, it is worth noting the important contribution of Catalonia to the country’s international projection, but also the nature of the principal elements by which Catalonia makes its contribution to Spain’s global presence. If Madrid is the Autonomous Community that participates the most in the economic and military dimensions of global presence (19.45% and 3.59%, respectively, in 2016), Catalonia is the region with the largest contribution to the soft dimension of the country’s external projection (7.49% in 2016). This leadership is also found in distinct variables (manufactures, migration, tourism, science, sports and information), some of which –as in the case of manufactured goods and science– were highlighted above as possessing higher value-added (at least potentially).
Spain: a European country, above all
For the 100 countries included in the Index, the methodology employed allows the volume of global presence to be calculated, along with its principal components (how the volume is distributed by dimensions and variables). In turn, this allows for an indication of the participation quota and position in the ranking of each country, in each dimension and variable. In addition, for the Member-states of the EU, these presences are also calculated (with their contributions, quotas, index values and ranking positions) within the EU space –what we have called the Elcano European Presence Index–.5 At the same time, the global presence of the EU is also calculated disaggregating contributions by geographic origin and identifying the relative contributions of each Member state. In the case of Spain, two years ago the Index6 began to also disaggregate global presence by geographic origin (as we reviewed, with respect to this edition, in the previous section).
Nevertheless, the distinct methodologies developed to date within the framework of this Project have not permitted a calculation for global presence by geographic destination. To apply this calculation to different countries or regions presented an important methodological challenge which, if it could be overcome, could provide very valuable information allowing for an answer to such questions as the following: what is the magnitude of the change in the axis of Latin American external action from the US towards China? What is the rhythm and depth of the process of European integration (which would be reflected in the magnitude of the presence of the Member states within Europe and its growth rate)? It is well known that China has significantly increased its presence in the world over the past decades, but exactly where is it projected? How much (and what kind of) Chinese exterior action is undertaken in Asia, and how much in other regions of the world?
To realise such a calculation would require, in short, ‘bilateralising’ the global presence of countries in each of its components (variables and dimensions). This is likely not to be feasible for each of the 100 countries included in this Index, given the need for databases which disaggregate this information in ‘bilateral’ form for each of the variables that comprise the Index.
Nevertheless, for this edition of the Index we have undertaken the calculation for Spain. With this new information, we gain both a snapshot and a sense of the evolution of Spain’s international projection in very detailed form. We already know what is the global presence of Spain, how it is composed by sector and geographically, and have identified the combined geographic and sectoral profiles (which communities contribute to which modalities of presence). Now, however, we can also know towards which regions and countries this presence is projected. With these findings and the analysis which follows, we wish to better inform Spanish foreign policy by contributing a deeper knowledge of Spain’s external action and presence.
The calculation incorporates an additional base of 5,757 data points that detail geographic distribution. It includes the breakdown by variables and dimensions of Spain’s presence in each of 25 countries and six regions for which we have gathered data for three moments in time (2005, 2010 and 2016). In this paper we limit ourselves to highlighting only a few of the principal results and findings.
With respect to the regional distribution of presence, Spain projects fundamentally into Europe (61.1% of the total Spanish global presence in 2016), and much less towards Latin America (13.6%), North America (8.4%), the Maghreb and the Middle East (7.2%), and Asia-Pacific (7%). Only marginal amounts of presence are projected towards Sub-Saharan Africa (2.7%) (see Table 2).

If the relative importance of each region in 2016 was approximately the same as it had been in 2005, there was significant divergence during the years of the crisis. In the second half of the 2000s, Europe absorbed somewhat less Spanish presence (falling 3.2 percentage points in 2010). This increased the proportions of presence projected towards the other regions, but especially towards Sub-Saharan Africa (5.6 additional percentage points in 2010). In the first years of the current decade, however, the trend reversed and the regional distribution of Spain’s global presence returned to its 2005 pattern. The crisis pushed Spain’s external projection, proportionally, towards Europe even more.
As was to be expected, the nature of Spain’s international projection varies with each region. While the links with Europe are mainly economic (more than 38% of the total economic presence in 2016) and to a much lesser degree soft, with very little military projection (16.8% and 6.2%, respectively) –a pattern similar to Spain’s presence in both Americas–, with Asia-Pacific the axis of Spain’s external projection is concentrated in the soft dimension, as it is with Sub-Saharan Africa (where, in addition, there is also some military dimension). This military axis is what clearly guides Spanish projection towards the Maghreb and the Middle East (see Table 3).

This data could also be read by sector: in all the dimensions, the principal focus of presence is Europe. In the economic dimension, both North and Latin America are of some importance, as are Asia-Pacific and the Maghreb and Middle East (if to a much lesser degree). In the military dimension, the most important region for Spain is Europe; far behind are Africa and the Middle East, while in the soft dimension the second most important region, after Europe, is Asia-Pacific.
These figures confirm certain intuitive ideas, like the centrality of Europe in the exterior projection of Spain, as well as the relative significance of Latin America compared with the rest of the world’s regions. Still, such a high concentration in Europe –which absorbs 60% of Spain’s global presence– is striking. In this context, the relative importance of Latin America might appear to be surprisingly low. Along the same lines, it might also seem counter-intuitive that Spain’s soft presence in Asia-Pacific would be higher than in Latin America, or that Spanish economic presence in Asia-Pacific is practically nil.
Naturally, the disaggregation by variables also reveals the importance of Europe as the primary destination of Spanish presence in many of them. This is the case, according to 2016 data, in all of the economic variables, in military equipment and in all the soft variables except sports (for which the largest proportion of presence is projected towards Asia-Pacific), and in Latin America (to where the largest proportion of development aid flows).
This European dominance is also clear in the international distribution of Spain’s global presence by countries. Its top 15 presence destinations in 2016 were the UK (13.5% of global presence, approximately the same proportion as all of Latin America), France (7.5%, in large part due to the border effect), the US (7.3%), Germany (7.1%), Italy (4.1%), Turkey (4%), Portugal (3.7%), Brazil (2.9%), Mexico (2.8%), China (2.4%), Belgium (1.8%), Venezuela (1.5%), Chile (1.4%), Morocco (1%) and Canada (1%).
In this case we can also find some counter-intuitive results. For example, the importance of some Latin American countries does not correspond to the level of attention that they receive from the national media. This would certainly be the case of Venezuela, where Spain projects less global presence that it does in Belgium, or that of Argentina, where with less than 0.8% it has less significance in Spain’s international projection than Canada.
The figures for Turkey might also seem surprising: it is nearly as ‘important’ as Italy for Spain and even more than Portugal. In this particular case the results are driven by a strong military presence, linked to participation in the NATO mission along the Turkish borders and in the deployment of Patriot missiles.

These proportion have also varied over time. The five countries where Spain’s presence has grown the most, proportionally, from 2005 to 2016 are Turkey (3.4 percentage points), Venezuela (1.1), China (0.8), the US (0.8) and the UK (0.8). On the other hand, the five countries in which Spain lost the greatest proportion of external projection are Portugal (-1.3 percentage points), Brazil (-0.9), France (-0.8), Germany (-0.8) and Argentina (-0.2).
These results are consistent with the ‘re-Europe-isation’ of Spain after the crisis, given that, as pointed out above, the trend has not been uniform in 2005-16. Europe lost relative importance for Spain during the first sub-period (2005-10) but it gained during the second (2010-16).
As shown in Map 1, behind each rise or fall in presence (in absolute terms) can hide very different combinations in terms of dimension. For example, in France, where Spain lost projection, a marked loss in economic presence was partially offset by an increase in the soft dimension.

Conclusions
After a rapid increase that began in the 1990s (with the profile of an emerging market economy and/or a peripherical European country), the global presence of Spain expanded significantly until the economic crisis. This prompted a drop of 50 points in the Elcano Global Presence Index during the period 2010-16. The loss was more than proportional in the economic sphere (despite the growth in exports) and was only partially offset by the soft dimension.
Spain’s global presence is constructed principally from Madrid, Catalonia and Andalusia (in line with the relative contribution of each of these regional communities to the GDP). Catalonia’s contribution to Spain’s projection of soft presence stands out. The contributions of the Canary and Balearic Islands to tourism, and of Andalusia and Murcia to primary products, are also significant.
With respect to destination, Spanish external projection is fundamentally European. It was before the crisis (in spite of some diversification towards other regions in the previous years) and it is now afterwards, even to a larger degree in relative terms (despite a decline in absolute terms). The data from this geographic distribution also produce some surprises: the projection of presence towards Latin America is possibly less than expected (the entire region absorbs the same proportion of projection as does the UK by itself), Turkey is one of the principal destinations (due to the military dimension), while Spain projects soft –not economic– variables towards Asia-Pacific. In fact, the latter is the only region in which Spain increased its global presence after the crisis in terms of absolute values, as a result precisely of its presence in the soft dimension.
The information which distributes Spanish global presence geographically allows us to have an idea as to how, and towards where, the country projects its presence beyond its borders. With this, we offer one more ingredient for an informed articulation of foreign policy, such that it serves to preserve this projection of presence (geographic and sectoral) or even to mould it.
Methodological note
To calculate the destination of the global presence of Spain we maintain the same structure and relationship between indicators as used in the Global Presence Index (found in the methodological annex to the Global Presence Report 2016), but we use country-to-country bilateral data.
To the extent possible, we have tried to use the same data sources as those used in the general calculation of the Index, relying on alternative sources only when necessary (principally national sources, all of which are specified in Table A1). In some cases, the bilateral breakdowns of the variables included in the original methodology of the Elcano Global Presence Index presented methodological challenges, obliging us to rely on alternative variables which allow for an approximation of this bilateral information.
The indicators of the economic dimension could be relatively easily broken down by destination, obtaining Spain’s bilateral exports to each destination, in each of the merchandise and service categories. This was also the case with exterior stocks of foreign investment, which were broken down by destination using national sources.
Data on military presence were disaggregated based on information facilitated by the Ministry of Defence –in particular, the geographic destination of Spanish troops deployed abroad–. For the breakdown of the military equipment indicator, the missions which made effective use of equipment were identified, and then equipment use was considered to be proportional to the number of troops deployed. In the same way, for naval missions, presence was based on both troops and equipment, while for training or observation missions, troops and deployment of equipment were not reflected in the methodology. We are grateful for the assistance of Felix Arteaga, Senior Analyst of the Real Instituto Elcano, in this respect.
In the case of the soft dimension, some variables could be ‘bilateralised’ by relying on alternative sources (like migration, tourism, culture, technology or development aid) but others presented conceptual or methodological challenges.
In the case of sports –measured in the original methodology of the Index based on the FIFA points of the national football team and the number of Olympic medals– for the breakdown by destination we have relied on television audience data. In the first case, we have taken World Cup audiences by country, based on data provided by FIFA. However, we have not been able to obtain this information for the Olympic Games. Therefore, it has been necessary to rely on an alternative measure. We have acquired information on the number of households with televisions in each country to produce an approximate measure of the potential audience for the Opening Ceremony of the Olympic Games.
The geographic breakdown of the information indicator also presented some challenges because of the way it is conceptualized in the original methodology of the Index, with its measure based on the number of mentions in the principal news agencies (Associated Press, Reuters, AFP, DPA, ITAR-TASS, EFE, ANSA and Xinhua) and the Internet bandwidth in each country. For the press mentions, we have relied on the same database (Factiva) but we have obtained the number of notices in each of the principal agencies related to Spain in each country and region of the world, considering the total number of spoken languages in each. With respect to the Internet indicator, given the impossibility of a geographic breakdown of the variable included in the original methodology, we have relied on the number of households with access to Internet in each country as an alternative variable, based on information facilitated by the International Telecommunication Union.
Finally, the science indicator is measured in the original methodology of the Index based on the number of scientific publications according to Thomson Reuters’s Web of Science indexing service. For the breakdown by geographic destination of the scientific presence of Spain we have taken into consideration those articles co-published by a Spanish author with other authors of other countries of origin, based on information from the Web of Science Core Collection of Clarivate Analytics. We appreciate the cooperation of Sebastien Vellay in securing this information.
In the case of the Autonomous Communities, the data used to determine their contributions to presence are, in the main, national public sources, as indicated in Table A2. Many of these are broken down by region; in contrast, as occurred with the bilateral breakdown of Spanish presence, there are cases which do not allow for a clear geographic distribution, or they are expressed in geographic entities different from the Autonomous Communities. These methodological challenges are explained in the document on Spain’s global presence presented last year.7 We therefore refer back to it in order to understand further details. We also include a table of all the data sources.
Iliana Olivié
Senior analyst at the Elcano Royal Institute and Coordinator of the Elcano Global Presence Index Project | @iolivie
Manuel Gracia
Analyst, Elcano Royal Institute | @mgraciasn
Mª Dolores Gomariz
Master in International Economics and Development (UCM), research assistant in training for the Elcano Global Presence Index project during the preparation of this document (2017)
1 Iliana Olivié, Manuel Gracia & José Ignacio Díaz (2016), ‘La presencia global de España’, ARI, nr 67/2016, Elcano Royal Institute.
2 The details of this methodology are in Iliana Olivié & Manuel Gracia (2017), Informe Elcano de Presencia Global 2017, Elcano Royal Institute.
3 Iliana Olivié & Manuel Gracia (2016), Elcano Global Presence Report 2016, Elcano Royal Institute.
4 It should be borne in mind that the variables directly related to public spending can lend a certain over-representation for Madrid given the methodology used. For details, see Olivié, Gracia & Díaz (2016), ibid.
5 All of the data are available, in open access, on the Explore and Data sections of the Elcano Global Presence Index webpage.
6 Iliana Olivié, Carola García-Calvo & Manuel Gracia (Coords.) (2015), Elcano Global Presence Report 2015, Real Instituto Elcano.
7 Olivié, Gracia & Díaz (2016), Ibid.