TWENTY-FOURTH EDITION OF THE BAROMETER OF THE ELCANO ROYAL INSTITUTE (June 2010)
Press Summary
TECHNICAL DATA
- Universe: general Spanish population, aged 18 and over.
- Sample size: N = 1,200 interviewees.
- Interview methodology used: telephone (interviewee called at home).
- Sample size: stratified, directly proportionate to the distribution of the national population, with proportionate quotas according to age and gender.
- Sample error: ±2.9 for global data (1,200n); ±4.0% for sub-samples (600n), p = q = 0.5 and a confidence interval of 95.5.
- Survey period: from 27 May to 18 June 2010.
- Field work: Gabinete de Análisis Demoscópico (GAD).
POSITIVE ASSESSMENT OF THE EU AND THE SPANISH PRESIDENCY
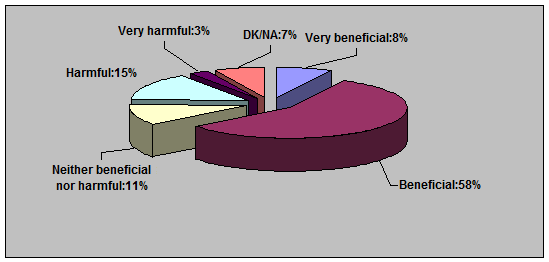
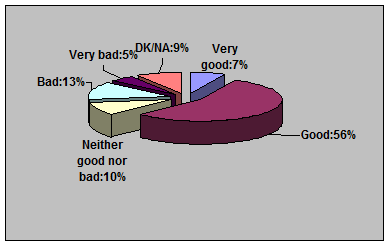
- Weighing Spain’s membership in the EU through the years, 65% of those polled think the EU has been good for Spain.
In general, in the years that have transpired since Spain joined the EU, how would you describe Spain’s membership?
Graph 1. Valuation of Spain’s EU membership
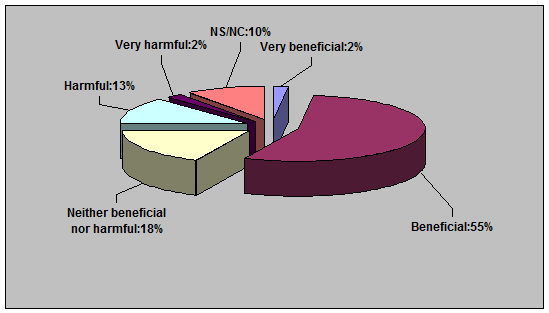
- A smaller but still significant percentage (55%) also feel that Spain’s membership has been good for the EU.
And how has Spanish membership been for the EU?
Graph 2. For the EU, Spain’s membership has been…
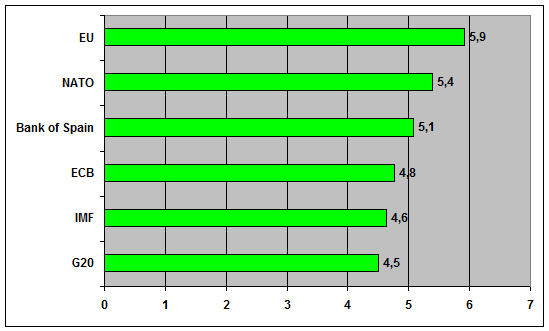
- The EU is the international organisation most highly regarded by Spaniards.
Graph 3. Average valuation of international organisations on a scale of 1 to 10
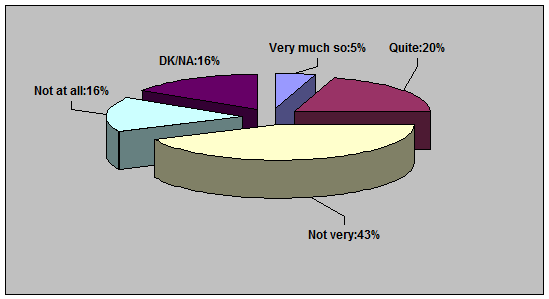
- However, 60% of those polled show no interest in Spain’s stint as rotating President.
And how would you describe how interested you are in the Spanish presidency?
Graph 4. Interest in Spain’s EU Presidency
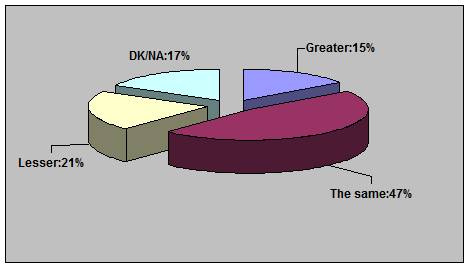
- One of every two people polled (47%) said they followed it with the same interest as other Presidencies.
In comparison with other Presidencies, is your interest greater, lesser…?
Graph 5. Spain’s EU Presidency: degree of interest compared to other Presidencies
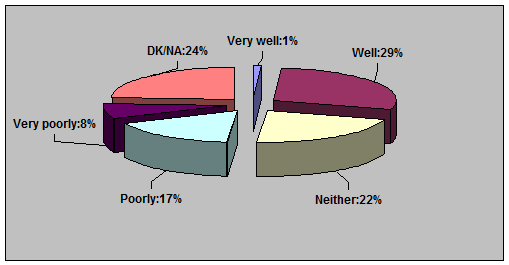
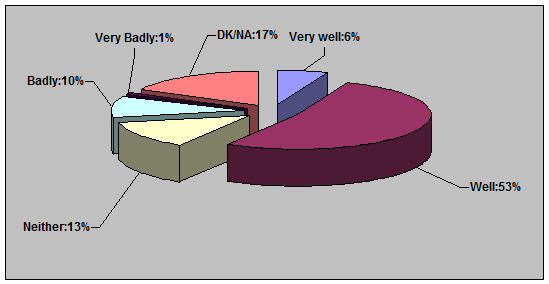
- 30% make a positive assessment of the Presidency, compared with 25% who say it went poorly.One of every two people polled is unable to express an opinion one way or the other, which is consistent with the lack of interest and awareness also shown by the survey.
Spain has held the rotating Presidency of the EU. How do you think it has gone, in general?
Graph 6. Valuation of Spain’s EU Presidency
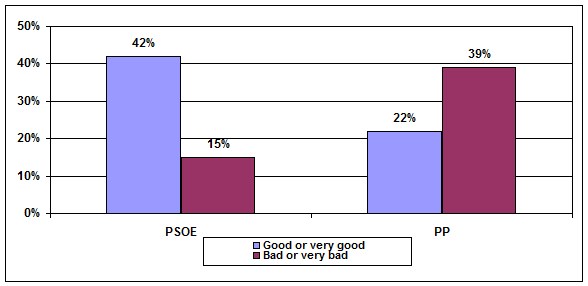
- Judgements are clearly governed by ideology, since the valuation is higher among PSOE voters than those who back the PP.
Graph 7. Assessment of the Spanish Presidency among people who voted PSOE or PP in the 2008 general election
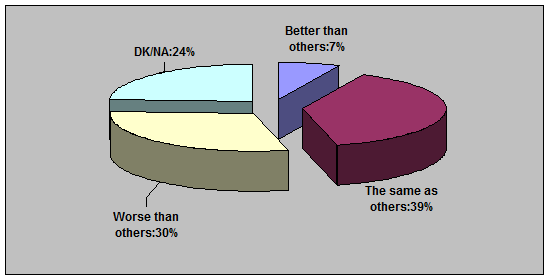
- In any case, 40% of those polled feel the Spanish Presidency was neither better nor worse than other rotating Presidencies although we do find 30% who said it was worse.
Do you think the Presidency went better or worse than others?
Graph 8. Was the Spanish EU Presidency better or worse than others?
ASSESSMENT OF GERMANY
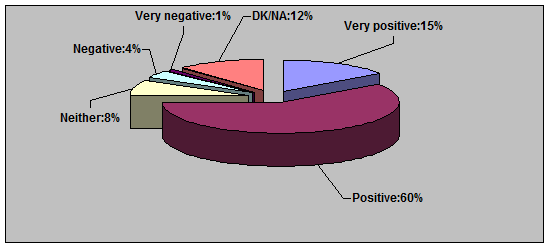
- 75% of Spaniards feel Germany has been beneficial for the EU.
Twenty years after the fall of the Berlin Wall, how would you describe Germany’s contribution to the EU?
Graph 9. Germany’s contribution to the EU
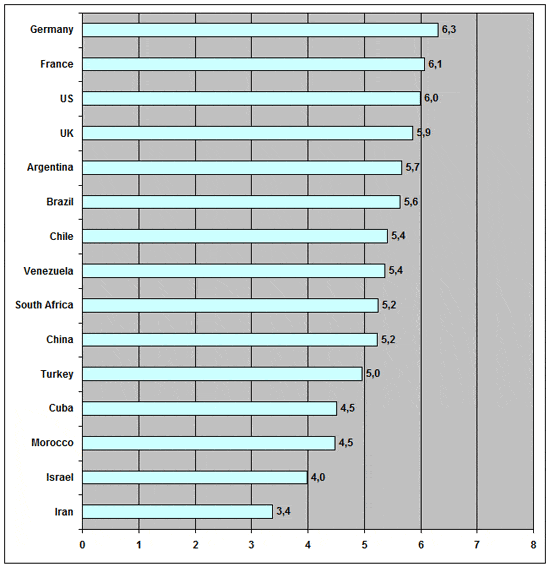
- Germany continues to be the country most highly regarded by Spaniards.
Graph 10. Average assessment of countries on a scale of 0 to 10
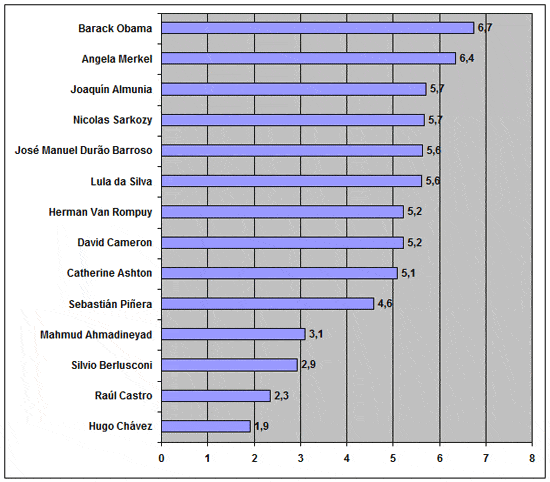
- Angela Merkel is the second-highest rated international leader, almost at the same level as President Barack Obama, the top-rated one, and a bit higher than third place Joaquín Almunia.
Graph 11. Average assessment of leaders on a scale of 0 to 10
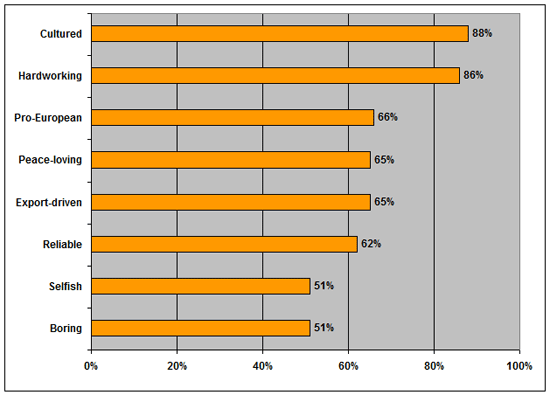
- Germany has a good reputation as a country that is hard-working, reliable and pro-European. The only two negative features associated with it are that it is boring and selfish.
Graph 12. Adjectives chosen to describe Germany
- In any case, a majority (60%) thinks Germany acted properly in the euro crisis and the Greek debt problem.
How do you think Germany acted within European institutions to resolve the Greek crisis?
Graph 13. Germany’s action in the Greek crisis
CRISIS
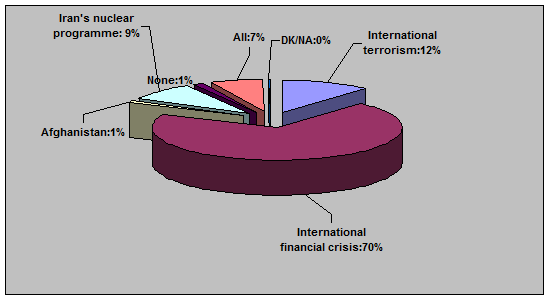
- The international financial crisis is the main worry for Spaniards, seven times more than international terrorism.
Of the following four problems, which would you say worries you the most right now?
- International terrorism
- The international financial crisis
- The situation in Afghanistan
- Iran‘s nuclear programme
Graph 14. Concern over international problems
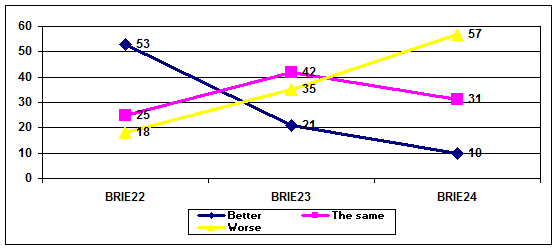
- Compared to the last wave of this poll, there is an increased feeling that the crisis has worsened, confirming that in terms of perceptions the crisis has the shape of the letter W.
Graph 15. Changes in opinion on evolution of crisis, BRIE 22 to 24
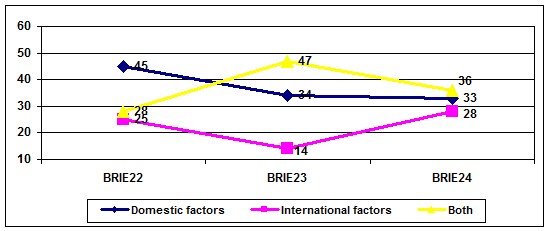
- There has also been an increase in the perception that the crisis stems from international factors.
Graph 16. Evolution of opinions on the importance of domestic and international factors in the economic crisis in Spain, BRIE 22 to 24
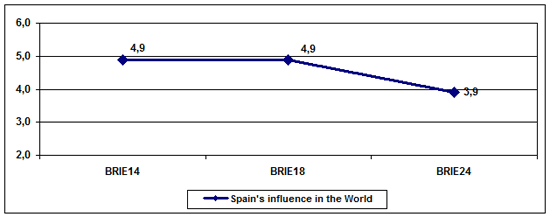
- Probably as a result of the crisis, people’s opinion of globalisation has worsened slightly in comparison with other waves of this survey. Another consequence of the crisis might be the assessment of Spain’s power in the world, which has gone down compared to earlier editions of the poll.
Graph 17. Evolution of the average assessment of the degree of influence or power that Spain wields in the world, BRIE 14 to 24
- This figure contrasts with the growing power attributed to China. One of every two Spaniards thinks it will be the world’s dominant power in the 21st century.
PUBLIC SPENDING AND AUSTERITY PLANS
- Sixty per cent of those polled accept the austerity plan that the EU imposed on Spain.
Recently, the EU forced Spain to undertake economic austerity measures because of the problems the country is facing. What do you think of this decision?
Graph 18. Opinion of austerity measures
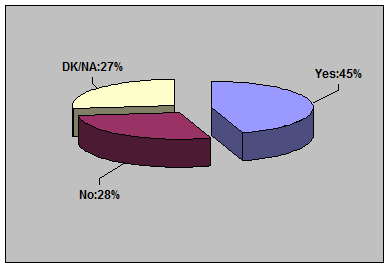
- Significantly, one of every two people polled (46%) says their opinion of the plan has improved since other European countries adopted similar measures.
Several countries, such as Germany and the UK, have announced austerity plans to reduce their budget deficits. Has this improved your opinion of the Spanish austerity plan?
Graph 19. Have the German and British austerity measures improved the opinion of Spain’s austerity plan?
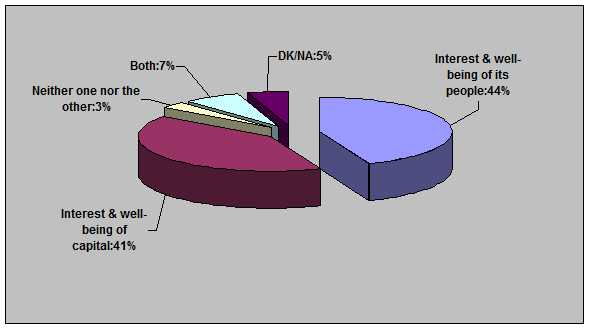
- Despite this, a significant portion of Spaniards (40%) feel that for the EU, financial concerns are more important than the well-being of Europe’s citizens.
On another subject, what is more important for the EU?
- The interest and well-being of its people
- The interest and well-being of capital
Graph 20. What is more important for the EU: the well-being of its people or of capital?
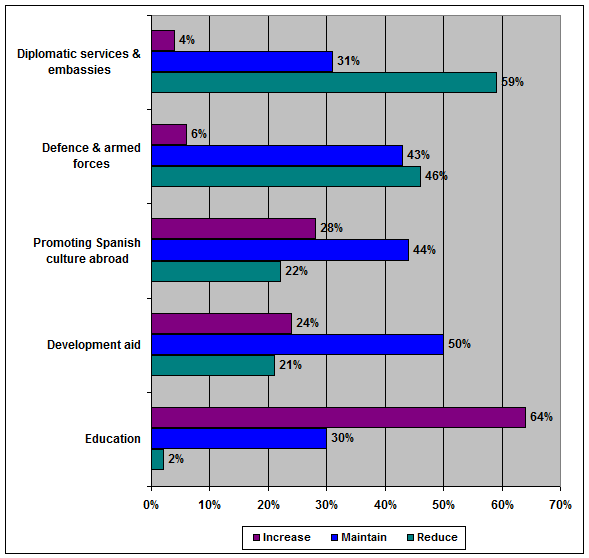
- Even in the current circumstances, Spaniards in general are wary of government spending cuts, except in diplomatic services and embassies. Most Spaniards prefer to maintain current spending levels in defence, promoting Spanish culture abroad and development aid. This pattern of demands for stable public spending in these areas of foreign policy contrasts with pressure for more investment in education. Two out every three Spaniards would like to see more spending in this area.
For the following areas, tell me if you support increasing, maintaining or decreasing government spending levels:
- Diplomatic services and embassies
- Defence and armed forces
- Promoting Spanish culture abroad
- Development aid
- Education
Graph 21. Opinion on whether government spending in certain areas should be increased, maintained or decreased
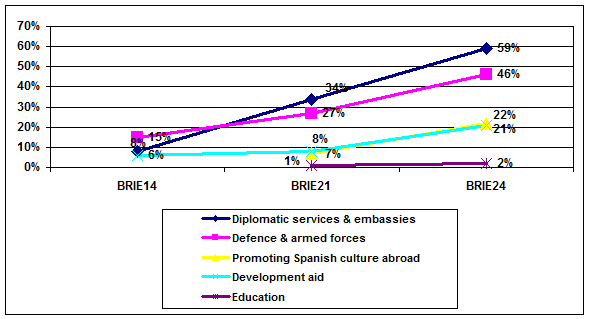
- All in all, there has been a clear change in attitudes, as over time there is increased acceptance of cuts in spending on defence and overseas diplomacy, and to a lesser extent in development aid. Again, these changes contrast with the stable level of opposition to cuts in education.
Graph 22. Evolution of demand for cuts in public spending, BRIE 14 to 24
IMMIGRATION
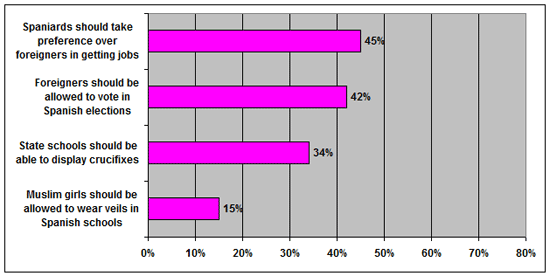
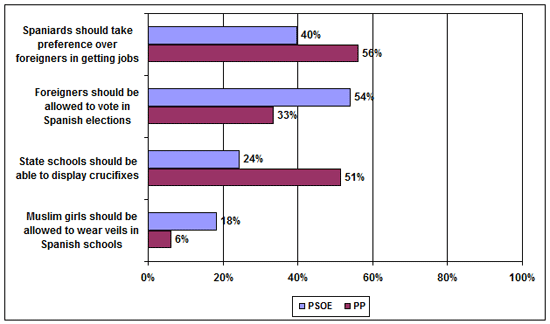
- An acute perception of the economic crisis is probably behind the fact that 45% of those polled feel that Spaniards should take precedence over foreigners when it comes to getting jobs in Spain, although 31% think they should not.
- On political issues, 42% back the idea of letting foreigners vote in Spanish elections, compared with 35% who are opposed.
- A significant percentage of Spaniards say they are against letting Muslim girls wear head veils in state schools: now the proportion is two out of every three (60%).
- But only one out of every three (30%) say they oppose displaying crucifixes in state schools. There is no majority opinion, however, as only 34% say they are in favour of letting them be displayed and another third of those polled say they are indifferent on the issue.
Graph 23. Level of agreement with certain statements on immigration
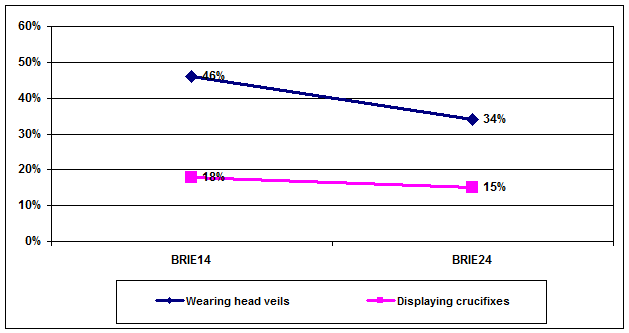
- The percentage of people who reject the Islamic veil has grown significantly over time. Certainly, news that some city and regional governments have banned them has something to do with this shift in opinion. In any case, with crucifixes, approval has also dropped 12 points. So it seems there is growing a consistency on keeping religion out of state schools.
Graph 24. Evolution of degree of acceptance of Muslim girls wearing head veils and crucifixes being displayed in state schools, BRIE 14 and 24
- We find clear differences between PSOE and PP voters on these issues, always in the same vein: conservatives are more intolerant with immigration than progressives.
Graph 25. Conservative vs progressive opinions on immigration
ISRAEL
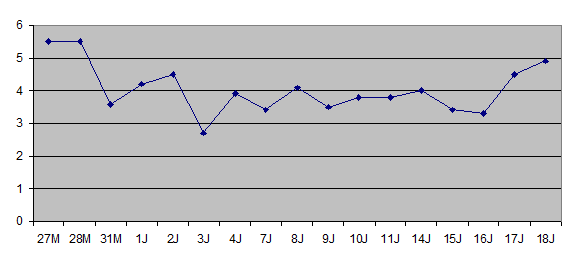
- After Israel’s attack on an aid flotilla bound for Gaza, Israel’s image has fallen nearly two points to practically the same level as Iran, the lowest regarded country.
Graph 26. Evolution of the assessment of Israel (27 May to 18 June) on a scale of 0 to 10
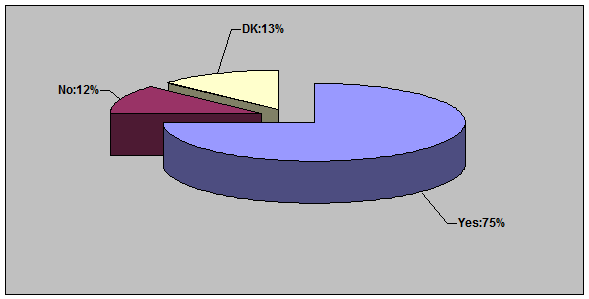
- 75% of Spaniards feel that the international community should take some kind of measures against Israel.
After the Israeli attack on the “Peace Flotilla”, do you think the International Community should take some kind of measures against Israel?
Graph 27. Should measures be taken against Israel?
MILITARY MISSIONS ABROAD
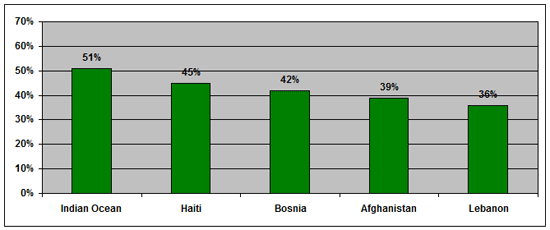
- There continues to be an excellent assessment of Spanish armed forces missions overseas. In the case of Afghanistan and Lebanon, the valuation is generally positive although there is also a high percentage of negative responses due to the dangerous nature of these missions. Those most highly regarded are the ones perceived to be least dangerous to the troops, such as the deployments in Bosnia, Haiti and the Indian Ocean.
Graph 28. Assessment of Spanish military missions abroad: percentage of ‘positive’ and ‘very positive’ responses


