2020 has been a year marked by the outbreak of COVID-19, lockdowns and a deep recession in the world’s economy. Yet, after a first pandemic-driven low in March 2020 the Nasdaq had risen 100% towards the end of January 2021 and, along with the S&P 500 and the Dow Jones Industrial Average, closed at record highs when the new American President Joe Biden took office on 20 January. In fact, the stock market reached new record levels during 2020 thanks to cryptocurrencies, especially Bitcoins, which soared by almost 300% last year, electric vehicles such as Tesla, which skyrocketed by nearly 750%, and tech and growth stocks.
This post aims to assess whether we are witnessing a stock bubble and whether there are similarities with the dotcom one at the beginning of the 21st century. The analysis presented here points out that a bubble is taking place in the stock markets, especially involving growth and tech stocks, but while the two bubbles share similarities, there are striking differences as well.
The most intuitive definition of a bubble comes from Stiglitz: a price high today means that investors expect that price to be higher tomorrow, however, when prices are not justified by business fundamentals, a bubble is taking place. Also, according to Minsky, a bubble can be characterized by five phases. The first phase features a systematic shift caused by new technologies or innovations. The second phase is constituted by low levels of volatility, expansion of credit and increasing rates of invested capital. The third phase is the so-called euphoria, during which prices grow exponentially due to high volumes of trade of overvalued assets, while the market starts to witness price volatility. During the fourth phase investors start to be conscious of the irrationality taking place in the market and move their position towards safer assets. However, during this phase, demand is still high as the market is sustained mostly by less sophisticated investors. The last phase of a bubble is when it bursts and prices fall rapidly, as Kindleberger and Aliber taught us.
According to McKinsey, in 2016, the so-called shift already took place as it coincided with the global move towards a more digital world in which technology changes how business is done. Regarding the second phase, the post 2008-period featured western central banks widely using expansionary monetary policies: these incentivised investors to allocate capital in the stock markets at ever increasing rates (Figure 1). The economic recession caused by COVID-19 was similarly followed by an easing of financial conditions in advanced economies that contributed to make markets frothy, according to Roubini: for instance, the FED’s US$2.3 trillion stimulus helped sustain households, businesses, and markets. Looking at the markets in 2020-21, one can argue that they are experiencing both the third and the fourth phase. In fact, 2020 has witnessed a boom of retail investors, which accounted for around 20% of all trading volume. Also, Charles Schwab reported 3.2 million new accounts in the first quarter of 2021, while the Robinhood app was downloaded more than 3 million times in January alone.

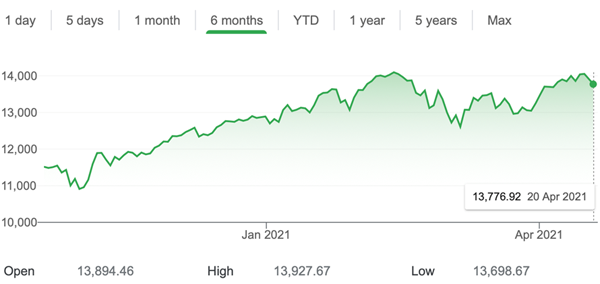
Towards the end of 2020 and beginning of 2021 volatility increased with respect to the previous period. Between February and March 2021, the market experienced some correction: the NASDAQ plunged as tech stocks reacted to the increase of the 10-year Treasury interest rates and investors changed their positions. As for the timing of the bursting, there is no real clue. However, there are strong geopolitical incentives to keep the markets reaching new highs as a sign of economic power. Indeed, Biden’s US$1.9 trillion stimulus appeased the markets, which, after some further correction, started to hit new highs again. However, volatility keeps characterizing the market trend (Figure 2). Finally, some investors are starting to be afraid of the possible tapering of the FED, which could in turn reproduce taper tantrum of 2013 and ultimately undermine stock markets.
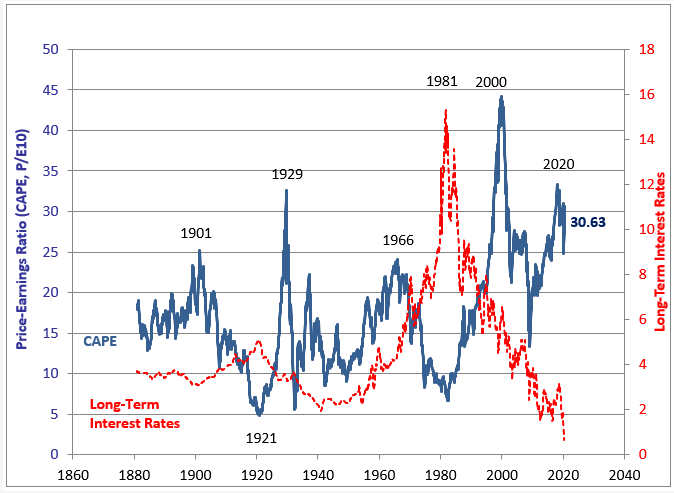
Lastly, let us analyse the similarities and differences between the current bubble and the dotcom one. Starting with the level of Initial Public Offerings (IPOs), 2020 marked 480 IPOs exceeding the 406 in 2000. However, thanks to new regulations, the median age of firms going public now is sensitively higher than the one during the dotcom bubble. This suggests that companies decide to go public when they are more mature, and thus less risky. Also, measuring long-term stock return, the CAPE ratio within the US market is not as high as it was 20 years ago: the current CAPE is 35 while it was closer to 45 in 2000 (Figure 3). Lastly, the economic, financial, and geopolitical environment is different: in the 2000s, markets were regarded as perfect, the economy was performing soundly, and the US were the undiscussed global hegemon. Today, markets are perceived to be flawed, the economy is facing a deep recession and the US is now struggling to keep its hegemony due to the rise of China.
All in all, it seems we are living within the third and fourth stage of a bubble involving cryptocurrencies, growth, and tech stocks, which show both similarities and differences with the dotcom one. Now the question is, how long will it take for the fourth phase to fully establish and eventually lead to the burst? Will we ever get to such a scenario, or geopolitical actors and interests will assist markets hitting new highs in the coming years?