Also available the Spanish version: ‘El ascenso de China y Asia: ¿qué nos dice el Índice Elcano de Presencia Global?’
Theme[1]: This paper uses data from the Elcano Global Presence Index to examine how Asia, and in particular China, are raising their global presence at a very swift pace.
Summary: Asia is the region of the world that has most increased its global presence, its economic presence and its soft presence between 1990 and 2012. And it has done so with a much greater intensity than other emerging regions. In Asia the most outstanding case is China, but most of the other nine Asian countries featured in the Elcano Global Presence Index have also contributed significantly. The enhanced prominence of Asia’s international presence was especially marked in the 1990s, until the Asian financial crisis of 1997, and again during the current international economic crisis. As for the type of presence, Asian countries have tended to first display a very strong and sustained growth in their share of economic and military presence, and, more recently, a more modest increase in their share of soft presence. The exception to this pattern is Japan, a post-industrial power that has recently undertaken a process of normalisation of its armed forces.
Analysis: The Elcano Global Presence Index quantifies the overseas projection of 60 countries, the world’s 49 largest economies plus 11 other countries which, while not part of that group, are members of the EU and/or the OECD. The overseas projection of these States is calculated on the basis of three dimensions: economic (energy, primary goods, manufacturing and services), military (troops and military hardware) and soft (migration, tourism, sports, culture, science, technology, education, information and development aid). In its edition released in 2012 the project included 10 Asian countries (China, Japan, South Korea, India, Singapore, Malaysia, Indonesia, Thailand, the Philippines and Pakistan), which together account for more than 88% of the region’s GDP.
China ranked second with regard to increasing its global presence in absolute terms from 1990 to 2012, and first in raising its share (3.6%). It is also the country that has most boosted its share of economic presence (4.2%) and soft presence (2.8%), and third in increasing its share of military presence (1.7%). This has taken China from 13th place to 4th in the global presence ranking, with a 5.1% share. The economic realm is not only the one in which China has most raised its presence; it is also the one in which China has accrued the largest share of presence (5.8%).
Graph 1. Change in global presence from 1990 to 2012
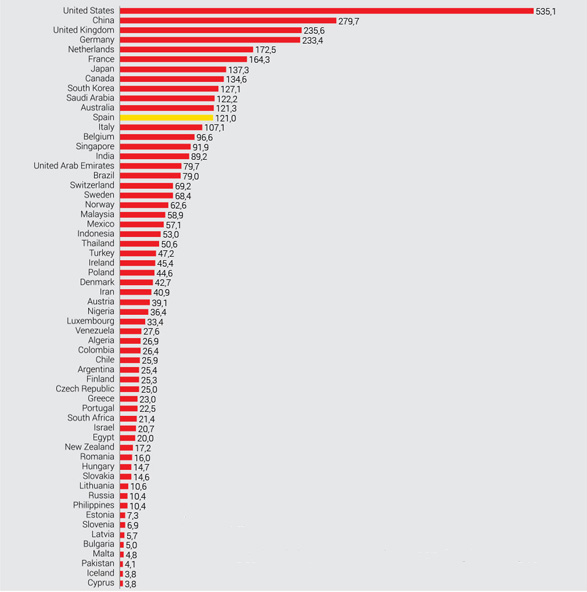
There is no doubt that China is the developing country with the greatest international weight. This is seen in the fact that the absolute increase in its global presence since 1990 equals that of the five countries of Latin America –or those in the Maghreb and the Middle East– with the strongest international presence. Further proof is the fact that the rise in China’s share of global presence is equal to the aggregate growth of the rest of the Asian countries included in the index, and greater than that posted by the Maghreb and Middle East (2.9%) and by Latin America (1.8%). This difference between the growth of China’s share of presence and that of the other developing countries is particularly clear in the case of soft presence. Here, China has risen 2.8%, compared with 0.1% for other developing Asian nations, 0.5% for Latin America and 0.3% for the Maghreb and Middle East.
Graph 2. Spread of global presence over the past two decades
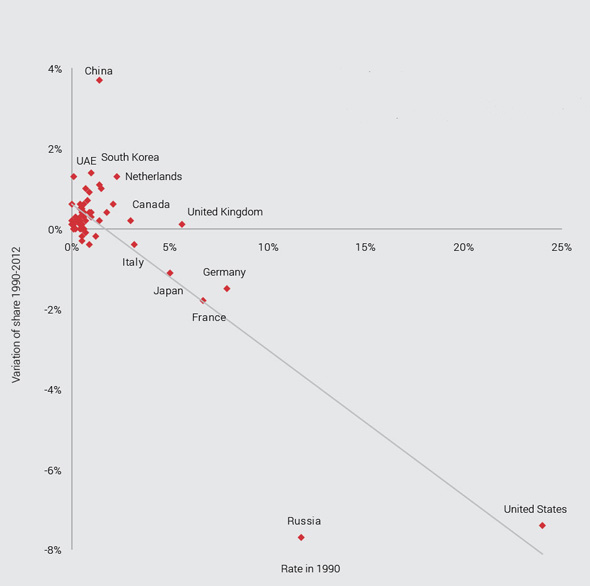
What is more, except in comparison to the US, whose international presence continues to grow faster than China’s, the gap between China’s pace of increase and the rest of the traditional world powers is becoming increasingly larger. Were the trend of the past two years to continue, China would become the world number two in international presence by 2020, overtaking the UK in 2015 and Germany in 2019.
In Asia, it’s not just China
Looking at Table 1 and the variations in the top 20 spots in the index ranking, we can see that between 1990 and 2012 Asia rose by 26 places, with four countries moving ahead. Two other regions have also gone up in the ranking, but to a much lesser degree. Latin America gained four spots, thanks to Brazil, and Oceania one, due to the effect of Australia.
Table 1. The top 20 spots on the Elcano Global Presence Index of 2012 and a comparison with the rankings measured in 2011 and 1990
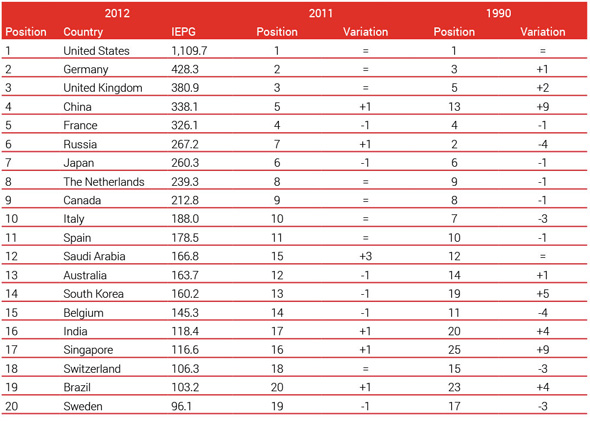
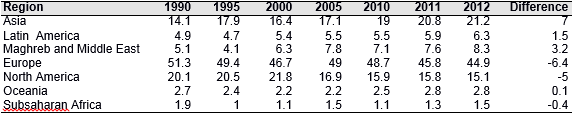
Table 2 shows that the growth in Asia’s share of global presence (7.2%) is greater than that of the rest of the regions combined (6.2%). Even excluding China, Asia’s share grew 3.6%, double the rise of Latin America and a 0.7% of share more than the Maghreb and the Middle East. As shown in Table 3, the rise in the specific weight of the international presence of Asia was especially strong in two periods: the decade of the 1990s until the Asian financial crisis of 1997 and starting with the international crisis that erupted in 2008.
Table 2. Evolution of shares of global presence by region, 1990-2012 (%)
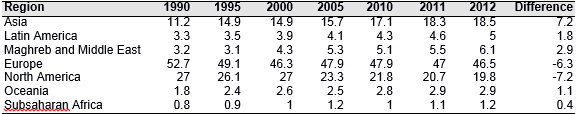
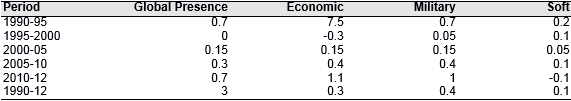
Table 3 shows that the rise in Asia’s share of presence is quite constant and across-the- board. Asia posted a decline only in the economic area in the period 1995-2000 and in the soft dimension from 2010-12. The first of the decreases was the most pronounced, at 0.3%, and stemmed from the effects of the Asian financial crisis, which hit especially hard in Thailand, Indonesia, South Korea, Malaysia and the Philippines, and was also felt in China, India and Singapore. Meanwhile, the recent mild contraction in the share of soft presence of Asia is mainly due to a decrease in Japan’s development aid and science and China having done worse in the London Olympic Games than in those of Beijing.
Table 3. Average annual variation in the share of Asian presence by dimension and period, 1990-2012 (%)
Asia, a heterogeneous region that is on the rise
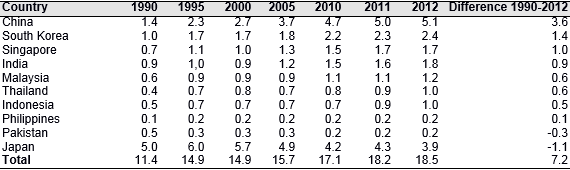
The evolution of the Asian countries’ international presence is not at all uniform (Table 4) and a distinction can be made between three kinds of country depending on the trend observed in their share of global presence: rising, stable and declining. Besides China, the status of which has been discussed above, significant rises in global presence have been posted by South Korea (1.4%), Singapore (1%), India (0.8%), Thailand (0.6%), Malaysia (0.6%) and Indonesia (0.5%). After an outstanding performance in the 1990s, all of these countries suffered setbacks, or at least stagnation, in their share of global presence because of the Asian financial crisis of 1997. But they managed to get back on course as the 21st century began. The first to return to a high pace of growth in their share of global presence were the States that had been less affected by that crisis –India (2000), Singapore (2000) and South Korea (2000)– followed by the developing countries of South-East Asia –Malaysia (2005), Thailand (2010) and Indonesia (2011)–. The only country of Asia with a stable share of global presence is the Philippines, which rose only 0.1% and did so before the Asian financial crisis. In other words, unlike the other developing countries of South-East Asia that are included on the Elcano index, the Philippines failed to regain the momentum it showed before the 1997 crisis. Only two Asian countries –Japan (-1.1%) and Pakistan (-0.2 %)– have seen their global presence shares decline between 1990 and 2012. Japan’s case reflects the typical pattern of post-industrial countries that see their global presence share dragged down by a relative fall in their economic presence (-2.5%) and, to a lesser extent, their soft presence (-2.2%). In the case of Pakistan, the rise in its share of military presence (0.8%) was insufficient to offset the fall in absolute terms of its soft presence, which implies a decline of 0.5% in the overall share of soft presence. The fall in Pakistan’s soft presence stemmed from a decline in the number of foreign migrants, mainly Afghan refugees.
Table 4. Evolution of the share of the global presence of Asian countries, 1990-2012 (%)
The relentless increase in the internationalisation of the Asian economies
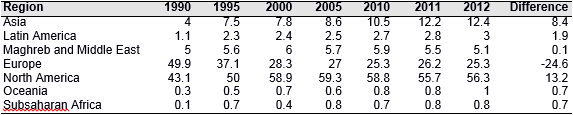
The economic realm is the one that mostly clear shows the rising international presence of Asia. It is also the one in which Asia has its greatest share of presence (Table 5). Furthermore, the region is the one to have posted the largest rise in its share of economic presence between 1990 and 2012 (7%), a percentage more than four times higher than Latin America’s (1.5%) and more than double that of the Maghreb and the Middle East (3.2%). The vast majority of the Asian countries included in the index have contributed to the rise. Japan is the only country in the region whose share of economic presence has declined over the period (-2.5%). The largest increase in the Asian countries’ share of economic presence was in the export of manufactured goods, which rose from 21% in 1990 to 26.5% in 1995 and 36.5% in 2012. What is more, this is the area of economic presence where Asian countries first started to appear among the top spots of the world ranking. Asia’s emergence as the world’s manufactory is clear if it is considered that in 2012 there were three Asian countries among the world’s top five exporters: China (1st), Japan (4th) and South Korea (5th). In 1990, there were just two Asian countries among the top 10: Japan (2nd) and South Korea (10th). Although to a somewhat lesser extent, Asian countries have also posted a significant increase in the percentage of the share of presence in primary goods and services. Asia has risen from accounting for 12% of exports of services in 1990 to 16% in 1995 and 21.5% in 1990, while its share of exports of primary goods reached 20% in 2012, rising from 16% in 1995 and 10% in 1990. The arrival of Asian countries to the top spots in exports of services took longer than it did for manufacturing: Japan (6th) was the only one in the top 10 in 1990 and in 1995 it had risen to 5th place, while Singapore made it into 10th. In 2012, there were four Asian countries among the world’s top 10 exporters of services: China (4th), Japan (6th), India (8th) and Singapore (10th). In 1995, South Korea became the first Asian country to break into the ranks of the top 10 exporters of primary goods, taking 9th place. In 2012 the trend strengthened and China took over the 8th spot while South Korea dropped to 10th. The weight of Foreign Direct Investment of Asian origin is much lower, as is the pace of its increase, going from 6% in 1990 to 8.5% in 1995 and 11% in 2012. Japan is the only Asian country that appears among the top 10 with the largest amounts of FDI overseas, although its role is diminishing. It fell from 4th place in 1990 to 5th in 1995 and finally to 6th in 2012. China and Singapore experienced a significant rise throughout the period. In 2012 they ended up 13th and 16th, respectively.
Table 5. Evolution of share of economic presence by regions, 1990-2012 (%)
The stunning rise in Asia’s level of economic development and its international presence in this area did not just happen by chance. One of the key factors driving it was a determined government strategy supporting investment in R+D. China, Japan, South Korea and India respectively have the world’s 2nd, 3rd, 5th and 8th largest budgets for R+D. South Korea and Japan hold 2nd and 3rd place in the world for percentage of GDP earmarked for research and development. Meanwhile China, despite being a developing country, invests in R+D a percentage of GDP (1.98%) which is greater than that of the EU (1.96%). Another reason for the successful growth of Asia’s economic presence is that its processes of economic internationalisation feature a high relative performance of exports in relation to investments. This gives rise to a series of advantages, among which are more vigorous economic activity and thus domestic employment, a balance in the current account and less exposure to country risk. It should be noted that one of the weaknesses of Spain’s production structure and of the internationalisation processes of Spanish companies is that they follow the opposite pattern, with a high relative performance of investments in relation to exports.
Asia’s international presence is not just economic
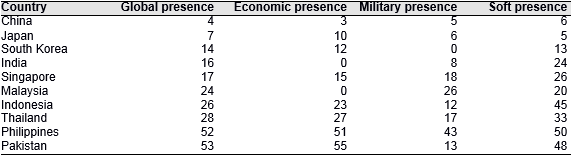
Comparing the positions of Asian countries in the ranking of global presence with their positions in the rankings for each of the three dimensions measured by the Elcano Global Presence Index (Table 6), the first thing to notice is that half of them have a significantly higher position in the military realm.
Table 6. Rankings of Asian countries in the Elcano Global Presence Index of 2012
This emphasis by Asian countries on enhancing their military presence is confirmed by the fact that this is the kind of presence in which Asia increased its share the most (8.4%) and the only one that has grown for all of the Asian countries or in all of the periods examined in the global presence project (Table 7). In fact, seven of the 11 countries that have increased their military presence the most from 1990 to 2012 are Asian. Still, the military dimension is the one in which Asia has a smaller share of presence (12.4%) due to the overwhelming US strength (55.8%).
Table 7. Variation in the share of presence of Asian countries by dimension (%)
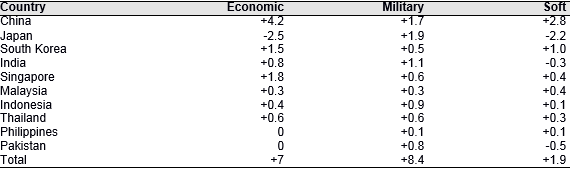
Two inter-related processes explain most of the increase in Asia’s military presence: the normalisation of Japan’s Self-Defence Forces and the modernisation of the People’s Liberation Army in China. After Japan’s defeat in World War II, its armed forces were subject to major restrictions both in terms of their ability to project force and to deploy troops outside Japanese territory. These limitations have been gradually eased since the early 1990s, and now a bill is being debated in Parliament to lift them completely and put Japan’s armed forces on a par with those of any other country. The process has led Japan to be the country that has increased its military presence the most in absolute terms from 1990 to 2012. The trend has accelerated significantly in recent years in response to the modernisation of the Chinese military, which has set off similar reactions in other countries around it. These measures are easily understood as Asia is a region with many ongoing international conflicts and without an effective security system to resolve them. In its bid to enhance its capability to defend growing interests outside its borders, Beijing has opted in a determined fashion to boost its military presence, the growth of which was the third largest, both in absolute terms and in share of presence between 1990 and 2012 (Table 8). In parallel, the conflict between India and Pakistan has triggered a significant increase in the military presence and share of military presence of both countries.
Table 8. Evolution of share of military presence by region, 1990-2012 (%)
Asia is the region of the world with the highest growth in its share of soft presence
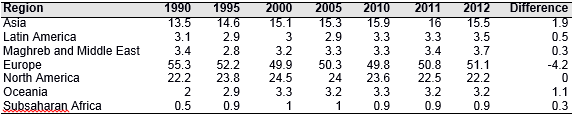
As is the case with global presence and economic presence, Asia is the region and China the country that have most increased their share of soft presence –by 1.9% and 2.8%, respectively–. Along with China, also standing out is South Korea, which scored the fourth-highest increase in share of soft presence (1%). The pronounced increase by both countries is closely linked to their progress in science and technology, to which must be added tourism and sports in the case of China. Soft presence is the one that shows a stable pattern of share distribution by region and the one in which Asia’s increase has been the smallest. This is because it is the kind of presence that most countries take longer to develop. In any case, the increase in the weight of Asia’s projection in this area was much larger than that of the other emerging regions (Table 9). The Asian country whose soft presence took off first was Japan, which accounted for most of Asia’s rise in the 1990s and hit its peak in soft presence in 2000. The rest of the Asian countries that rose in soft presence did so mainly in the 21st century, after having scored more significant rises in their shares of economic and military presence. Examples are China, India and Malaysia. China’s share of military presence grew twice as much in the 1990s (1.2%) as it did in the first decade of this century (0.6%), while the rise in its share of soft presence followed the opposite pattern, growing 0.9% in the 90s and 1.8% the following decade. Malaysia, meanwhile, increased its share of military presence in the 1990s, but not in the ensuing 10 years, while its share of soft presence did not begin to rise until the 21st century. India, which has a lower level of socioeconomic development, saw a decline in its share of soft presence in the 1990s (-0.4%), which shifted to a very a small increase in the following decade (0.1%), while its share of military presence underwent a much more marked increase: 0.4% in the 1990s and 0.8% in the following decade.
Table 9. Evolution of shares of soft presence by region, 1990-2012 (%)
Conclusion: The data featured in the 2012 edition of the Elcano Global Presence Index allows us to state firmly that since the end of the Cold War we have witnessed a significant contraction in the specific weight of the global presence of the traditional powers. By far Asia is the region that has benefitted most from this redistribution of regional shares of international presence and within Asia the high profile role of China stands out. Emerging Asian powers show a pattern of foreign projection based first on economic and military variables, and more recently on soft variables. The rise of Asia was particularly intense in the 1990s, until the Asian financial crisis of 1997, and during the current international economic crisis. Still, Asia remains far behind Europe and North America except in its share of economic presence, which is greater than North America’s. It will be interesting to observe how the slowing down of several Asian economies, including China, might influence the evolution of their global presence in the next few years.
Mario Esteban
Senior Analyst for the Asia-Pacific region at the Elcano Royal Institute and Professor of East-Asian studies at the Autonomous University of Madrid
[1] The author is grateful to Iliana Olivié for her valuable observations, which have enriched this study.