

Theme
This paper analyses the main results of the 2025 edition of the Elcano Global Presence Index.
Summary
In the context of a growing geopolitical competition and the questioning of the world order, the Elcano Global Presence Index allows us to measure and compare the evolution of the globalisation process in terms of its volume, nature and geographical configuration. The results of the 2025 edition show that globalisation has declined by 1.4% in the aggregate global presence of the 150 countries measured, which is mainly due to a shrinkage in the economic dimension. Meanwhile, military presence grows, and the soft power dimension recovers shyly after the pandemic but loses traction. The globalisation process has regained its ‘harder’ components.
The US stays atop the global presence ranking, followed by China and Germany. We highlight the climb of India, Russia and Japan, in contrast with the fall of some European powers. This is not the case of Spain, which records the largest increase of all the EU-27 countries with respect to the previous year and retains its 13th position. The EU remains ahead of the US, but it registers downward trends in its outward projection, with uneven performances depending on the country. China registers a decline in absolute presence for the first time, while the US gains some. Despite this, results suggest that we are far from a new bipolarity, since the EU is claiming its prominence. Despite tensions, globalisation carries on, though differently than in the past, more fragmented and less homogeneously than in previous decades.
Analysis
The first quarter of 2025 is a strong candidate to go down in the history of the 21st century. The start of Donald Trump’s second Administration confirms a drastic shift in the US’s stance towards the core elements that had guided the globalisation process since the 1990s. In the words of Marco Rubio, Secretary of State at the White House, ‘the postwar world order is not only obsolete; it is now a weapon being used against us’. An episode comparable to the so-called Nixon shock from the 1970s, when the US unilaterally decided to put an end to the Bretton Woods system guaranteeing the conversion to gold of circulating dollars.
Recent years had revived the debate over the evolution of globalisation, its slowing down (slowbalisation)[1] or even its reversing (deglobalisation),[2] and, in either case, it had become clear that globalisation was not a homogeneous process, but rather one that produced both winners and losers, both between countries and within them. The Great Recession of 2008 marked a first turning point, especially for European countries, and the 2020 pandemic exposed the vulnerabilities associated with high levels of interdependence, further fuelling protectionist views. Meanwhile, Trump’s first presidency planted the seeds of the current US stance, promoting a zero-sum view of the world order, where relative gains by some –at the expense of others– are understood as symptoms of declining power.
The globalisation of the 1990s welcomed the idea of a world without ideological confrontations, at the same time that the technological revolution blurred the importance of geography.[3] In this context, the theoretical foundations of the neoliberal approach materialised in policies of external openness, free trade and the facilitation of capital flows, consolidating the notion that economic interdependence was a mechanism of security. This concept was evident in the foundations of the European integration process,[4] in the Germany-Russia relationship and in the balance of payments interdependencies between the US and Japan or China. Moreover, various regional integration processes –such as the EU, NAFTA and ASEAN– were established as mechanisms for external competitiveness, while the promotion of openness as a path to development was extended through multilateral institutions like the IMF, WTO and World Bank. This paradigm reduced the role of industrial policy in the assignment of productive specialisations, even questioning the role of states in globalisation.[5] Overall, it was a world in which the ‘hard’ elements of globalisation seemed to give way to ‘soft’ elements, characterised by the non-coercive use of power among nations.
However, the parameters that guided the process of globalisation as we once knew it are now being challenged. The technological consolidation of China, the material demands of the energy and digital transitions, and the return of ideologies and geography as defining elements of foreign policy have pushed the multilateral order towards a world of geopolitical competition between states, a rise in nationalism and growing unilateralism, where external dependence is increasingly seen as a vulnerability. Trade protectionism is once again understood as a tool of foreign policy, accompanied by national industrial policies and strategies for greater autonomy from external actors. Additionally, the return of war to Europe has remilitarised international relations, reducing the appeal of soft power in external projection. Although it remains uncertain whether these changes will permanently alter the structural foundations of the globalisation we know, the historical magnitude of the transformations already underway is clear.
To contribute to this debate, the Elcano Global Presence Index proves highly useful for three reasons. First, it highlights the importance of understanding globalisation as a combination of three main dimensions of external projection: economic, military and soft power.[6] Secondly, by offering results dating back to 1990, it allows for an analysis of the evolution of globalisation both in terms of its overall volume and of its nature, according to the relative importance of each dimension. Third, it is calculated individually for 150 countries, enabling the observation of different national profiles, and its aggregation provides a comprehensive measure of the globalisation process as a whole.
This paper focuses on three main areas. First, it examines the volume and nature of the globalisation process between 1990 and 2024. In a certain way, the data presented in this edition offer one of the last snapshots of the globalised world of the first two decades of the 21st century.
Secondly, it analyses the main changes in the global presence ranking. By using a quantitative index, it identifies the gap between countries and provides empirical evidence to the narrative of the transition from the bipolar world of the 1990s –dominated by the US and the former Soviet Union– to the multipolarity that characterised the peak of hyper-globalisation, and the alleged move towards a new bipolarity, this time between the US and China.
In this new fragmented world, however, the EU also seeks to exercise global leadership. Therefore, thirdly, the paper compares the evolution of the global presence of the US, China and the EU, identifying the elements that have driven their external projection and quantifying the gaps in the different indicators that make up the Elcano Global Presence Index.
Figure 1. Aggregate value of the Elcano Global Presence Index, in index value, 1990-2024
To measure the volume of globalisation, we aggregate the value of global presence of the 150 countries or which we calculate the Index. According to these results (Figure 1), there has been a retreat of 1.4% in the globalisation process between 2023 and 2024. Given the multidimensional character of the Index, it is possible to analyse whether the decline has been generalised, or whether there are indeed differences between indicators.
The economic dimension fell by 3.5% compared with 2023. This was due, on the one hand, to a sharp drop in energy and primary goods exports, following the stabilisation of international prices. On the other hand, it followed the contraction of the manufactures trade globally. In contrast, exports of services and the global stock of foreign direct investment (FDI) increased. Globalisation is fundamentally an economic process, and this dimension was the driving force during its peak expansion period. However, since the 2010 financial crisis, its aggregate behaviour has been erratic, even recording absolute declines. The pandemic also impacted the economic dimension, affecting both service exports (notably tourism) and goods exports, due to disruptions in global supply chains.
Another key feature of globalisation in the 1990s was the demilitarisation of international relations following the end of the Cold War. Interdependence was seen as a guarantor of peace, reflected in the declining importance of the military dimension relative to the economic one. Today, however, an increase in military presence can be observed across several countries, particularly in Asia, mainly through the expansion of military equipment and, more recently, the deployment of troops abroad. As a result, the military dimension grew by 1% over the past year, largely due to the sharp rise in troop deployments, driven by Russia’s military operations in Ukraine. In comparative terms, the current number of deployed troops worldwide –nearly 900,000– is 1.3 times higher than in 2005, overtaking the levels seen during the US wars in Iraq and Afghanistan. The growth in military presence would have been greater were it not for a slight reduction in the stock of military equipment[7] (notably in Italy and the UK),[8] due to the replacement of older assets. Meanwhile, other countries (China, the US, Russia, India and generally the Asia-Pacific region) have significantly increased their naval units, bringing the aggregate military presence of the Global North and Global South close to parity. In fact, if one takes out the US, the Global South surpasses the Global North in terms of deployed military presence.
Lastly, the soft power dimension has regained some of the momentum it had before the pandemic. However, the rapid growth observed between 2010 and 2020 slowed down (Figure 2). The fastest-growing indicator in the past year is Tourism (27%), following the update of post-pandemic data; followed by Climate (6.2%), driven by increased renewable energy generation capacity; and Culture (5.6%), boosted by the export of audiovisual services.
Figure 2. Aggregate evolution of global presence dimensions, base 100 = 2010 (left) and base 100 = 2020 (right)
1. The Asian surge and European erosion: key takeaways from the global presence ranking
The 2024 Global Presence ranking (Figure 3) confirms the continued leadership of the US. China holds second place, although still at a considerable distance, followed by Germany, Japan and the UK.
Figure 3. Global presence ranking 2023 and 2024, top positions
(Updated: 26/05/2025).
Compared with 2023, a significant development has occurred: the US has increased its global presence, while China has lost some. Over the past year, Japan, Russia, France, India and Spain have also gained presence. In fact, Spain recorded the second-largest increase in global presence in 2024 (second only to the US) and the largest among EU countries. In contrast, Germany, the UK, Canada, the Netherlands, Italy, Belgium, Switzerland and Australia all experienced declines.
Changes in absolute value can cause shifts in ranking, which is uncommon for an index that better captures structural trends than short-term fluctuations. Over the past year, Japan has overtaken the UK to reclaim the 4th position it held in the 1990s; Russia has surpassed France, which now ranks 7th, its lowest position since records began; and India has climbed to 9th place for the first time, pushing the Netherlands and Italy down by one place. Meanwhile, South Korea and Spain have managed to maintain their 11th and 13th positions, respectively.
Figure 4. Evolution of the Global Presence Ranking, 1990-2024
Asian countries have managed to maintain or even improve their positions in the ranking, while European countries have either lost ground or merely held their positions. On the one hand, countries such as Japan and India show balanced growth across all dimensions, reflecting a well-rounded growth. On the other, South Korea maintains its expansion in its soft power projection, while China –despite losing ground over the past year due to a decline in its economic dimension– retains its second place, still well ahead of Germany.
European countries also show varied trajectories. Post-Brexit, the UK continues to lose economic presence, although it has managed to recover some growth in its soft presence, still not enough to hold its position vis-à-vis Japan’s rise. France also drops one position, overtaken by Russia, which increases solely due to its military deployment in Ukraine. The Netherlands experiences an overall decline across all dimensions and loses its position to India, while South Korea surpasses both Italy and Spain.
2. Towards a new bipolarity?
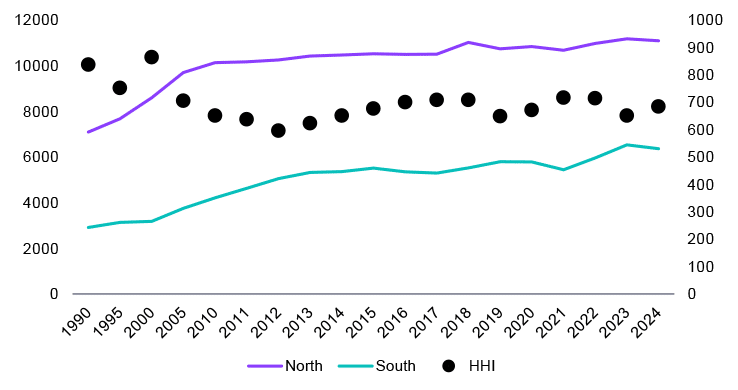
To assess the degree of global presence concentration, we use the Herfindahl-Hirschman Index[9] (see Figure 5), although the results do not clearly point to a trend towards a new bipolar order. A clear de-concentration is observed between 1990 and 2012 –indicative of growing multipolarity– followed by a slight reconcentration afterwards. Still, today’s levels of concentration remain significantly lower than in the 1990s, though this may vary depending on how alliances between countries are defined. At the same time, the gap between the Global North and South remains substantial, and we are still far from an evenly distributed globalisation.
Figure 5. Aggregate evolution of global presence for the Global North and South, and HHI value
To provide a geographically differentiated analysis, Figure 6 shows the changes in global presence by country between 2020 and 2024. Generally, since 2020, globalisation has been driven by the US and China, while the EU has seen a notable decline. Africa, South-East Asia, and to a lesser extent, Latin America, have also experienced decreases in global presence. Notable exceptions to this trend include India and Brazil, both of which have increased their global presence over the past four years.
Figure 6. Absolute changes in global presence between 2020 and 2024
It is worth noting that when calculating the EU’s global presence, only its extra-regional ties are considered, thereby excluding the relations between its member states. These results therefore point to a reduction in the EU’s presence beyond its borders. This is particularly relevant because the idea of regional integration as a mechanism for competitiveness has been one of the pillars of globalisation as we know it. If we look at the evolution of EU countries individually (both intra- and extra-regionally), the picture is quite uneven (Figure 7). Since 2020 the main European engines –France, Germany and Italy (along with the UK)– have experienced losses, while more moderate growth has occurred in the European periphery, notably in Ireland and Poland. In other words, the diagnosis for the EU is not the same when focusing on its external ties versus analysing individual countries.
Figure 7. Change in global presence of EU countries, 2020-24
Therefore, we are witnessing a globalisation process that is far from uniform across regions. Asia and North America are gaining presence, while Africa, Latin America and especially Europe are losing it. But the process is not uniform within regions either, as seen in Latin America, where countries like Brazil and Chile are gaining ground, or in the context of the South-East Asian countries that lose presence.
3. Fractured globalisation: the power struggle between the US, China and the EU
In the current context, there is growing debate over the EU’s ability to act as an independent global player. Its loss of presence appears to signal a diminished role on the global stage. However, when comparing its trajectory to that of the US and China (Figure 8), three trends stand out. First, the EU continues to hold the highest level of global presence in the entire dataset, despite a significant decline from 2020 onwards. Secondly, the US had been gaining presence since 2010, and although the trend was interrupted before the pandemic, it grows in presence over the past years. Third, China stalls its growth, which had been strengthened with the pandemic, recording, for the first time in the series, a drop in global presence in absolute terms.
Figure 8. Evolution of global presence of the US, the EU and China, 2005-24
Recent variations can largely be explained by the economic dimension. The EU has reduced its economic presence (outside of the EU), while slowly regaining its soft power projection. The US has slowed its growth due to lower dynamism in goods exports, but continues to increase its services exports and foreign investment. Meanwhile, China is losing ground due to a decline in both manufactured goods and services exports, although it continues to gain in the military and soft power dimensions.
Under a zero-sum perspective, gains in global share by some –which necessarily imply losses by others– may be interpreted as transfers of power. However, this does not have to signal a negative outcome for globalisation. For instance, China has gained in global export quotes, yet this has occurred alongside an acceleration in US export growth (as the world’s second-largest exporter of manufactured goods), as well as a rise in Chinese imports (China being the second-largest importer of such goods).
Figure 9. Global presence of the US, China and the EU by indicator (log scale)
The distance between the US, China and the EU is narrower in the economic dimension and wider in the military and soft power dimensions, albeit with nuances (Figure 9). The US leads in energy and primary goods, China in manufactures, and the EU in services and investments. In the military realm, the gap stems largely from deployed troops, where the US leads, and regarding Equipment, China has surpassed the EU. China’s advantage is concentrated in just a few indicators, and the gap widens when it comes to soft power indicators such as Migration, Tourism, Sports, Education and Development Cooperation –areas traditionally at the core of soft projection–.
Conclusions
The first quarter of 2025 marks a turning point in the globalisation process, after the clear intention of the US to reshape the global order. As such, these data from the Elcano Global Presence Index (1990-2024) may represent one of the last snapshots of globalisation as we have thus far known it.
Since 1990, globalisation has gone through a post-Cold War demilitarisation period, followed by a surge in the economic dimension that was interrupted by the 2010 Great Recession. Since then, the soft dimension took the lead for some time, but the pandemic and today’s conflict-laden context have brought back the ‘hard’ elements of globalisation. Over the past year, the global presence aggregate value has contracted, driven by a slowdown in world trade, while the military dimension has grown, and the soft dimension recovers modestly.
The US has led –and continues to lead– the globalisation process. Although China is the country whose presence has grown the most in recent years, the gap between the two powers remains substantial. The continued rise of Asian countries and the relative decline of European ones has caused India, Japan and Russia to gain ground. The UK, France and the Netherlands have lost positions, while Germany retains third place despite absolute losses. Spain, for its part, is the EU country with the largest gain in 2024, maintaining its 13th-place ranking.
Although the trend towards the dispersion of global presence seen before 2010 has been interrupted, there is no evidence of a return to the kind of bipolarity experienced in the 1990s. Moreover, the EU remains a global actor. Its overall global presence remains higher than that of both the US and China, even if it may have been in decline for several years. Yet the EU does not act as a unified actor: its global projection is built on the sum of its members’ individual projections, which often reflect divergent or even conflicting interests.
There are notable differences in how the three main contenders for global leadership project themselves internationally. The US maintains military dominance and leads in many indicators across dimensions, despite its apparent retreat from exercising soft power. China leads in manufacturing, but not in other economic or military indicators, and it seems to lack the appeal to significantly increase in soft power, which remains limited. The EU, while leading in services, investment and several soft-power indicators, struggles regardless to capitalise its high presence into power.
The return of geography as a defining factor invites thinking about globalisation as fractured, with three distinct spaces –the US, the EU and China– each with its own logic, according to which other countries unevenly align. This adds a layer of complexity to an increasingly less homogenous globalisation process. It is too early to know the scale of transformations that will take place, but it seems evident that the pace and nature of the globalisation process have changed. We find a globalisation that regains its ‘harder’ elements, and that seems to fracture in geographical terms. Considering all this does not necessarily imply there is less globalisation, though it certainly implies there is a different kind to the one we have known so far.
[1] Alicia Garcia-Herrero (2022), ‘Slowbalisation in the Context of US-China Decoupling’, Intereconomics, vol. 57, nr6, p. 352-358.
[2] Catalin Postelnicu, Vasile Dinu & Dan-Cristian Dabija (2015), ‘Economic deglobalization – From hypothesis to reality’, Ekonomie 18, nr 2, p. 4-14.
[3] Thomas Friedman (2006), The World is Flat, Farrar, New York.
[4] It is worth recalling the famous quote by Robert Schuman in his 1950 declaration: ‘The solidarity in production thus established will make it plain that any war between France and Germany becomes not merely unthinkable, but materially impossible’.
[5] Saskia Sassen (2003), ‘The state and globalization’, Interventions, vol. 5, nr 2, p. 241-248.
[6] The concept of soft power was introduced by Joseph Nye in 1990 to describe the ability to exercise power through non-coercive means, as opposed to hard power. This concept has since become widely used in the analysis of international relations, although no universally accepted definition exists. The Elcano Global Presence Index proposes a methodology for measuring soft power through the indicators of Migration, Tourism, Sports, Culture, Education, Information, Technology, Development Cooperation and Climate. For further information see the methodological note of the Index.
[7] Considered strategic mobility assets: aircraft carriers, frigates, cruisers, destroyers, nuclear-powered submarines, amphibious assault ships, medium and heavy strategic transport aircraft, and aerial refuelling aircraft. For further information see the methodological note.
[8] Italy loses one aircraft carrier and one destroyer. The UK loses three frigates, two of them due to refurbishing. The US is down four cruisers and one Los Angeles-class submarine and introduces a new Virginia-class submarine.
[9] The HHI is a calculation often used to measure levels of concentration through the sum of quotas squared. High values signify high levels of concentration, which in this case would be a synonym for little multipolarity.