We have just launched a new edition of the Elcano Global Presence Index, that refers to 2019. In this tenth anniversary (already!) and as in previous years, we are adding ten new countries; so that the Index is now calculated for 130 countries from all regions, accounting for 99% of the world economy and 94% of its population.
These new countries are Afghanistan, Albania, Bahrein, Bosnia and Herzegovina, Cambodia, Georgia, Laos, Madagascar, North Macedonia and Nepal; meaning that the Global South is increasing its presence in the global presence index… and that a great deal of Asian, Latin American and African countries’ external projection is now observed by this tool.
Top ten countries. Same old, same old
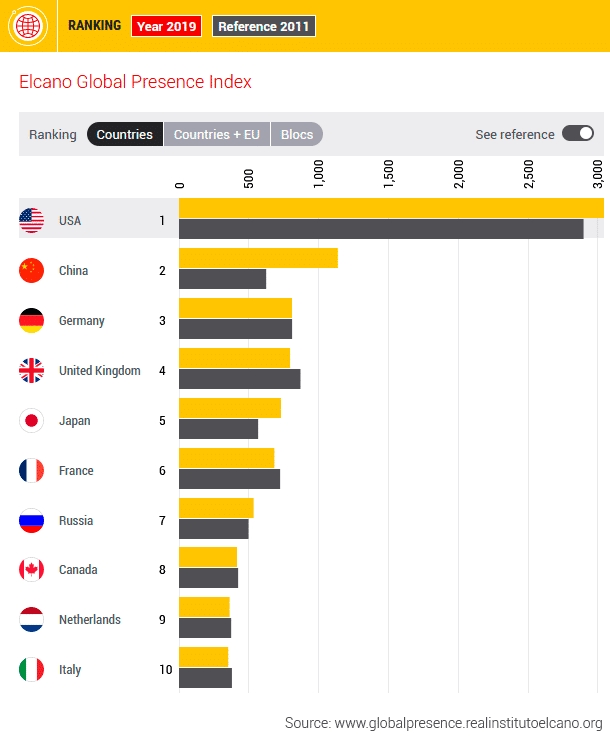
Top ten countries are the US, followed by China, Germany, the UK, Japan, France, Russia, Canada, the Netherlands, and Italy. All of them hold the same positions they held in 2018 and, most of them, in 2017 (with the exception of the UK and Germany that have switched their positions). In short, old powers are still hanging on to their positions in the top of the ranking.
Asia keeps rising…
However, there are some interesting movements, that seem to consolidate the trends observed in previous editions. China has grown (and is still growing) into a top global player; while other Asian emerging countries have been consistently increasing their global presence, therefore surpassing Latin American and European countries in the top 20 positions.
China has climbed nine positions since 1990. It was 8th in 2000-05, 5th in 2010-12 and then upscaled one position per year until 2015, remaining, since then, in the 2nd place. So, it could be argued, China has already emerged and achieved its external projection potential. Nevertheless, the evolution of its index value shows a slightly different picture. In the mid 2010s, China belonged to some sort of cluster made of countries with a similar level of global presence. The UK, China and Germany all had index values of between 789 and 837 points in 2014; far from the external projection of the US, at 2,998 that same year. But China has left the cluster. Index values for the UK and Germany are still at 796 and 809 points, respectively, while that of China has increased to over 1,137 points. Although it is far behind the US (at 3,044 points in 2019), the gap between the two countries is narrowing systematically. In only one year, China’s global presence has grown from 33% to 37% of that of the US.
In 1990, India, South Korea and Singapore were in the 17th, 20th and 39th positions of the ranking, respectively. They were far behind countries such as Spain or Brazil. These three Asian countries currently hold the 13th, 11th and 17th. India is now at only 12 index value points from Spain; having narrowed the gap from over 120 points in 2010, while South Korea has already surpassed this European country.
… While the West keeps decaying
Spain’s global presence is at 285.4, down from 292.9 the previous year and from a maximum of nearly 339 points in 2011; a retrenchment that has mainly affected its economic dimension (via investments).
This behaviour is consistent with that of its environment.
Between 2018 and 2019 (that is, in the pre-COVID phase), all main Western countries recorded losses in terms of global presence (accounted in index value points). This includes the US (with a massive loss of more than 300 index value points), Germany, the UK, France, Canada, the Netherlands, or Italy.
The world was already deglobalizing before the COVID-19 pandemic
Indeed. The added value of global presence (including all 130 countries, variables and dimensions) –which reflects the volume of world exchanges and, therefore, can be used as a proxy of globalization–substantially decreased between 2018 and 2019, before the COVID-19 global pandemic. In this particular sense, the pandemic might be accelerating previous trends.
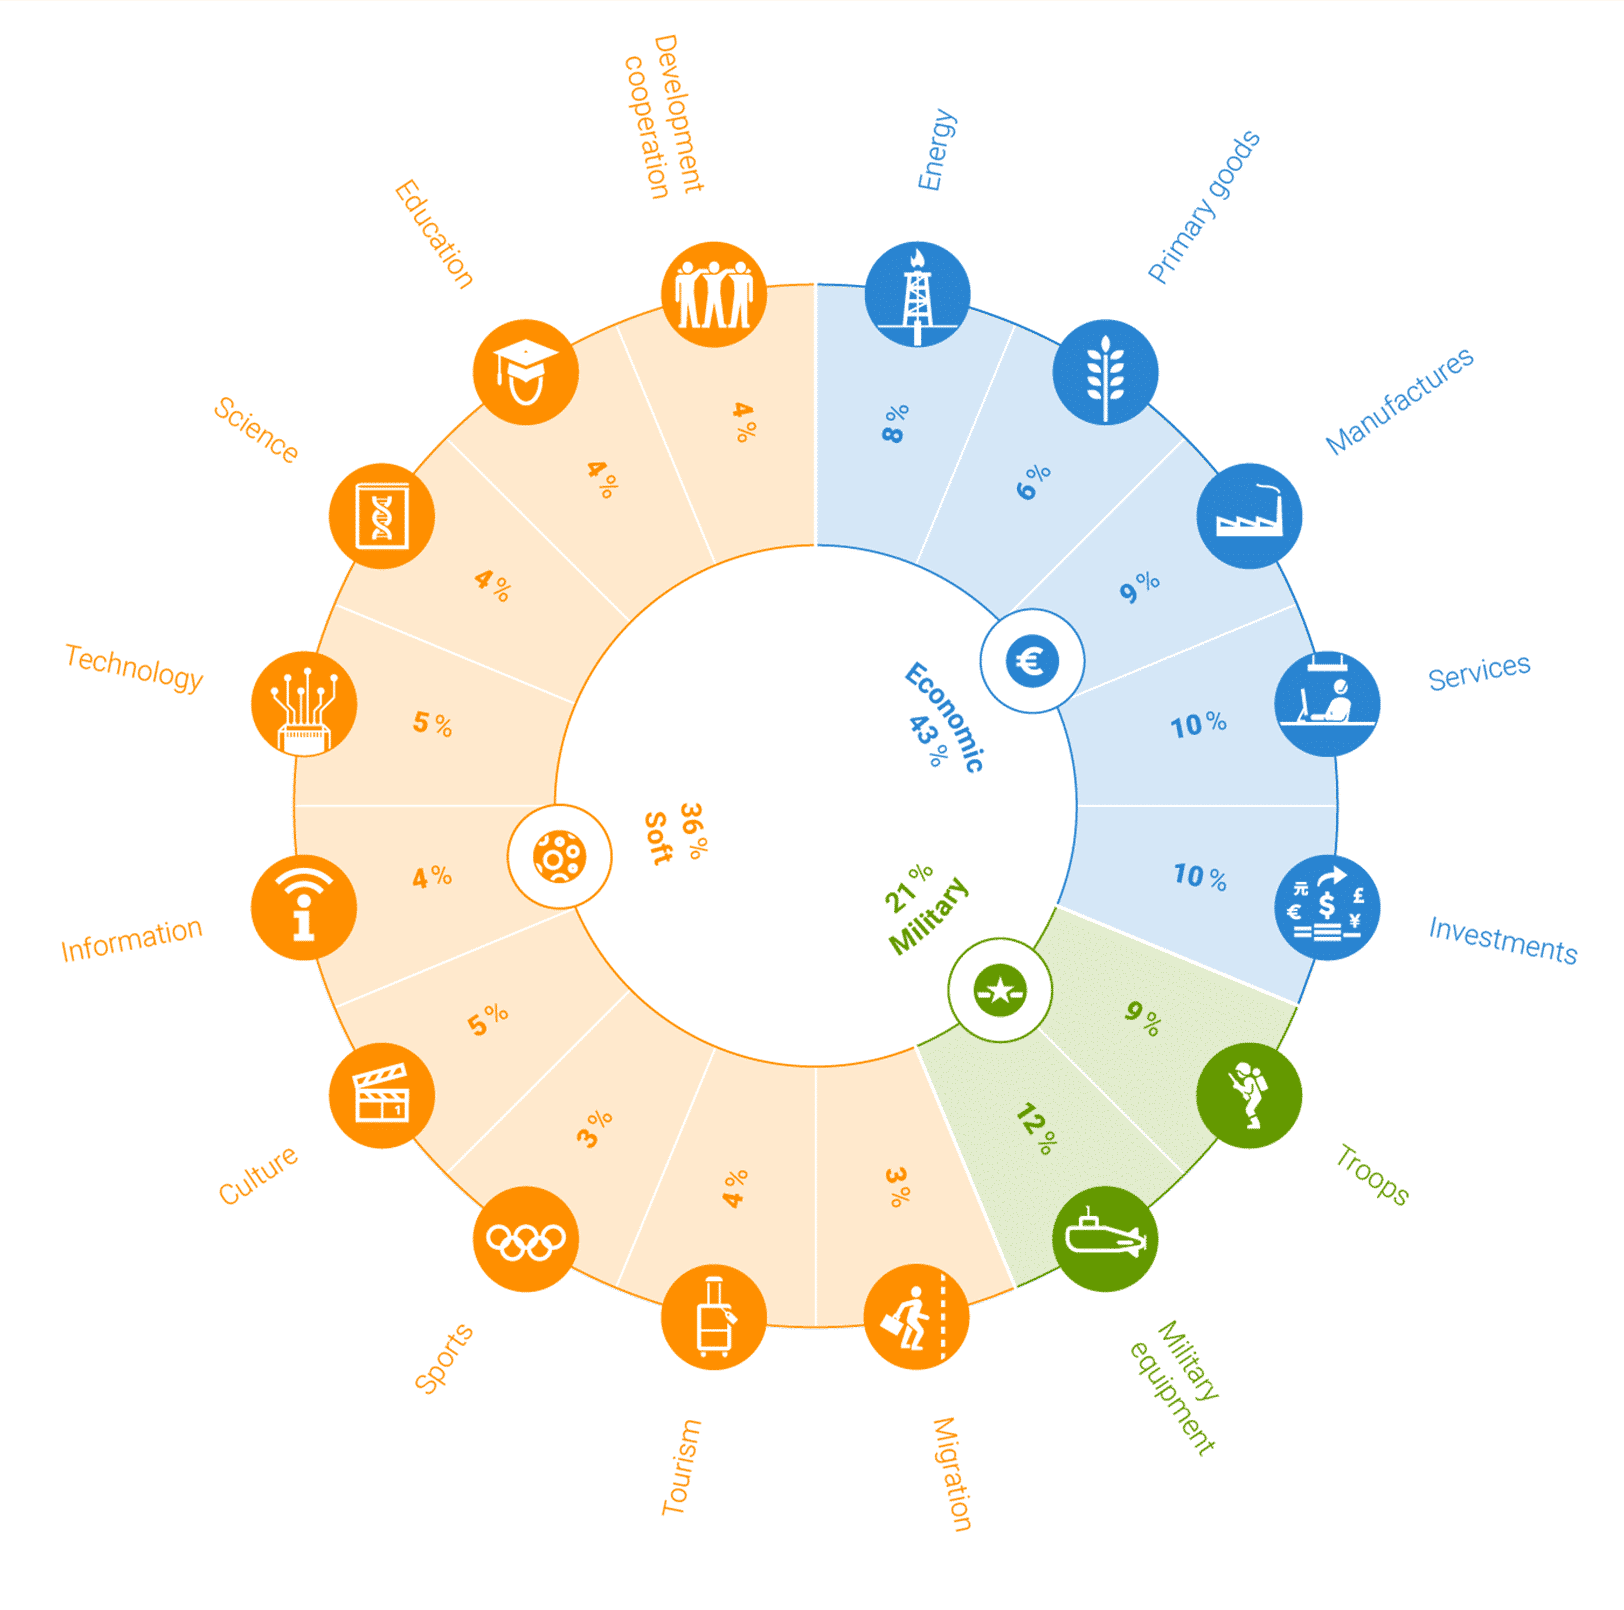
Globalization decreased by 2.6% in only one year; the largest drop in the whole time series, even including the deglobalization phase that immediately followed the fall of the Soviet bloc. This is due to a dramatic decrease of the economic dimension (-5.2%) and despite discrete increases of the military (0.8%) and soft (1.1%) domains.
However, only five out of the 16 variables that compose the Index record falls during last year. Primary goods, migration, culture and development cooperation all have value losses of between 0.1% and 1.9% while investments fall by 11.5%. In short, the world deglobalized between 2018 and 2019, mainly due to the economic dimension and, more specifically, to investments.
Moreover, this decrease correlates with the performance of this variable in US global presence, as a result of Trump Administration fiscal policy and its impact on foreign investment. This does not necessarily mean, however, that productive capacities have been insourced back to the US territory as such flows can be the result of decreasing outward FDI stocks but also of companies’ profits repatriation.
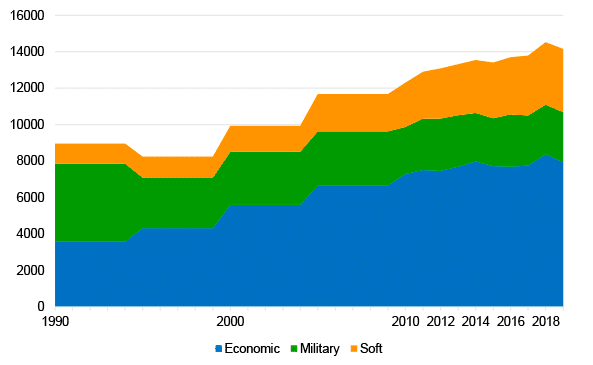
These results go in line with the general trend that arose after the 2008 crisis, with world economic exchanges losing track, slight movements in the military dimension and a sustained increase of world soft links, that now lead globalization.
Lastly, we should bear in mind that this trend towards deglobalization might be exacerbated in the following years, as a result of the COVID-19 pandemic and the subsequent decrease in economic exchanges and cross-border movements of people in various forms (migrations, tourism or education).
Methodology
In each new edition we try to improve the Elcano Global Presence Index with some methodological changes. This year, in addition to the inclusion of ten new countries, we have improved the measurement of three indicators: technology, culture and sports. These changes apply to the whole time series, starting in 1990, thus offering continuous data.
In the case of technology, we had a debate with a group of experts about the most suitable way to measure global presence though this variable. Until this edition we had been considering foreign-oriented patents as a means of quantifying the technological external projection of countries. After the consultation with experts in technology and innovation, we have added the external income for the use of intellectual property, using Balance of Payments data, as way to take into account countries with relevance in the technological field through the use that others make of their previous innovations, even if they do not take the form of a patent issued from that country.
In the case of culture, the measurement of this variable was being done exclusively with audio-visual trade data, considering exports of audio-visual and related services (film productions, radio and television programs, and music recordings) provided by the World Trade Organization (WTO). In this new edition, considering the UNESCO classification of cultural activities and the last revision of Eurostat, we have also included the trade of cultural goods (such us heritage, books and press, visual arts, art craft, performing arts, etc.)
Finally, the indicator of sports, originally measured by the Olympic medals and points in the FIFA world ranking of men’s absolute teams, was already improved in last edition with the inclusion of data on the performance of football clubs. In this edition, we have added FIFA points of women’s absolute teams, with the intention of reducing the existing gender gap and also reflecting a reality that contributes to the external projection of the countries they represent.