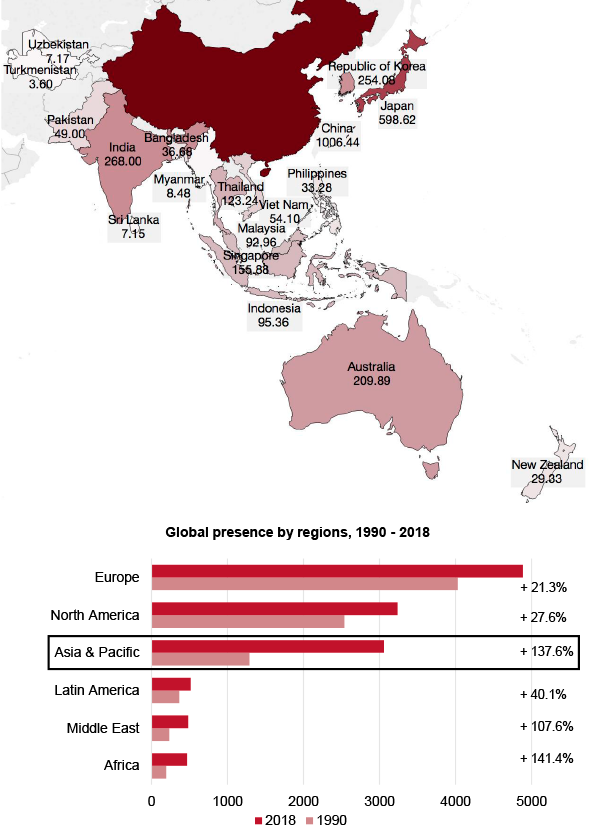
The Elcano Global Presence Index includes 19 countries from the Asia-Pacific region, 99.5% of the region’s GDP and 96.7 % of its population. By regions, Asia-Pacific ranks now third in the global presence ranking (with an index value close to that of North America), after recording an impressive growth since 1990. Its external projection is strongly concentrated in China and Japan (over 54% of the region’s presence) and led by China.
A (not only) economic giant
-
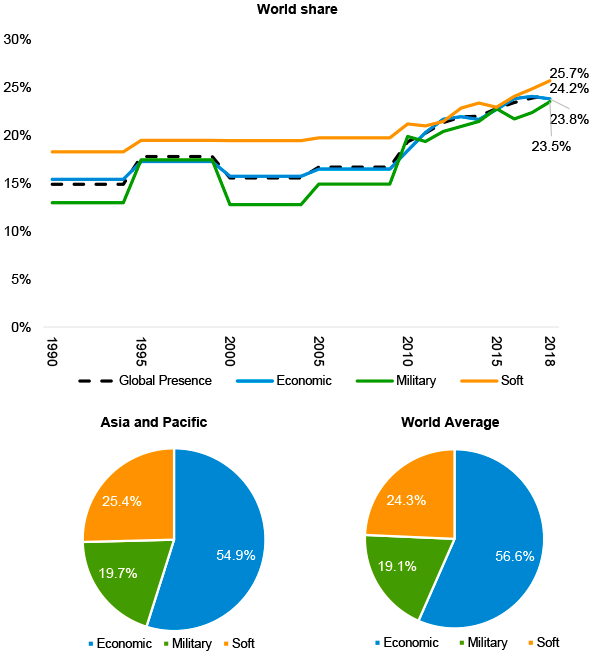
- The region’s profile is very in line with the world average, thus with a higher contribution[1] of the soft dimension and a growing military profile.
- All dimensions have grown since 2010. In a context of shrinking global presence of rich regions, Asia-Pacific increases its world share[2] by 10 percentage points since 1990.
Increasingly diversified external projection
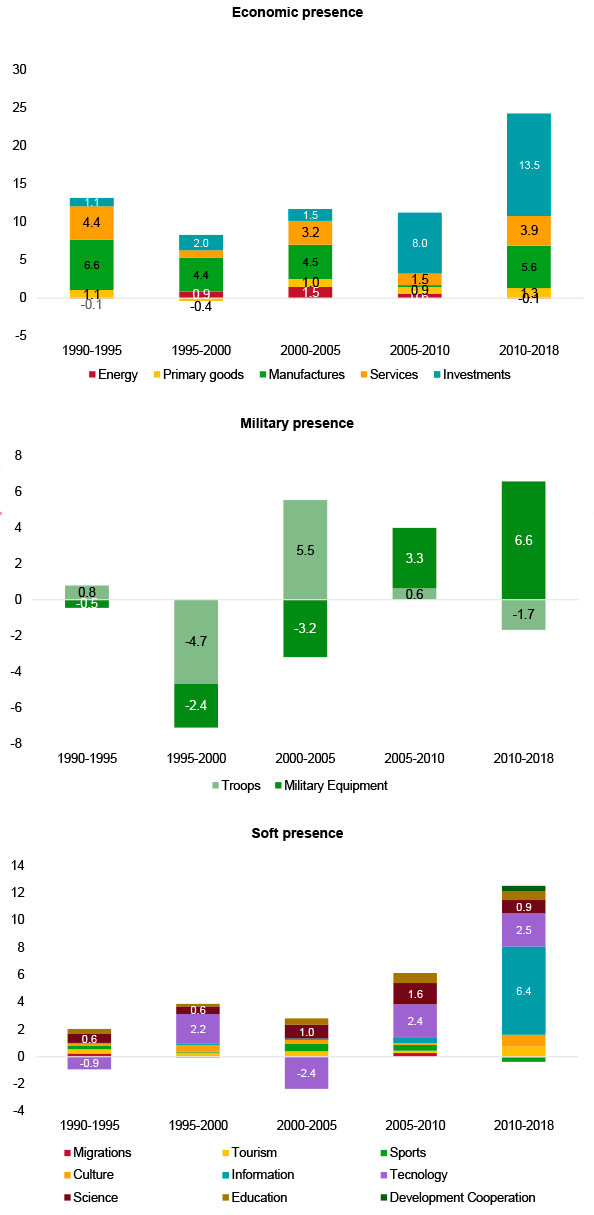
- Manufactures, but also services and, increasingly, investments drive the growth economic projection;[3] signaling the development of regional value chains.
- The military dimension is driven by the expansion of military equipment (mainly naval), partly due to growing tensions in the South China Sea.
- Scientific-technological variables drive soft presence growth, consistently with exports sophistication.
The emergence of the East
- Unlike in other developing regions (like Latin America), most Asian-Pacific countries (15 out of 19) upscale positions in the Elcano Global Presence Index ranking. Six Asian countries have entered the world top-20.
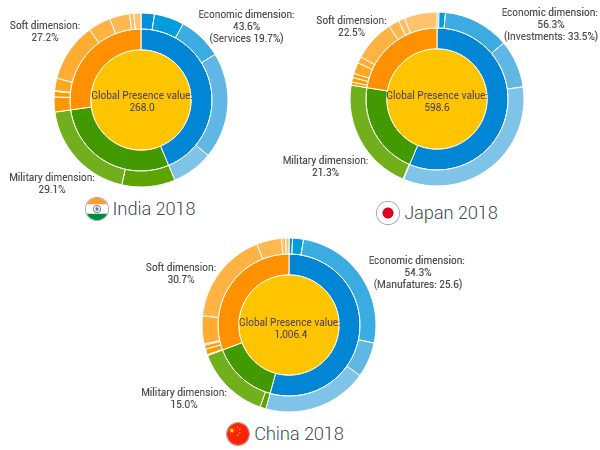
- China ranks second globally, consolidating its regional leadership. Japan struggles to maintain its position, while India remains a sleeping giant.
- These three countries have similar external projection profiles, with a strong technological-scientific soft dimension, surprisingly, a relevant military dimension, but with differences inside the economic pillar: manufactures and, increasingly, investment in China; investment and shrinking manufactures in Japan; and services in India.
Ranking of the countries in the region (variation 1990 – 2018)
| World ranking position | Var. 1990-2018 | |
|---|---|---|
| China | 2 | +8 |
| Japan | 5 | +1 |
| India | 11 | +3 |
| South Korea | 13 | +4 |
| Australia | 14 | +2 |
| Singapore | 17 | +16 |
| Thailand | 23 | +15 |
| Indonesia | 27 | +4 |
| Malaysia | 28 | +13 |
| Vietnam | 36 | -23 |
| Pakistan | 39 | -10 |
| Bangladesh | 48 | +14 |
| Philippines | 50 | +6 |
| New Zealand | 55 | +6 |
| Kazakhstan | 56 | +64 |
| Myanmar | 82 | +22 |
| Uzbekistan | 91 | +18 |
| Sri Lanka | 92 | -20 |
| Turkmenistan | 103 | +6 |
Elcano Global Presence Index, Elcano Royal Institute
Silent leaders?
- Singapore’s ranking position and external projection growth is surprising given its size: 38th in GDP, 96th in population
- Unlike Uzbekistan’s, Kazakhstan’s global presence kept growing after the fall of the USSR.
- Bangladesh’s growth has been driven by manufacture exports, and, more significantly, by the military dimension due to its high contribution to UN Peacekeeping Missions (2nd world contributor after Ethiopia).

[1] The presence contributions are the magnitude that each dimension or indicator represent in the global value of a country’s presence, expressed as a percentage of a country’s total global presence.
[2] The share or quota of presence represents the weight of a country’s presence record -global or by dimensions- over the added record of all countries.
[3] This driver value shows the real contribution of each variable to global presence growth, calculated by multiplying the growth of each individual variable by its weight over total global presence in the previous year.