

Original version in Spanish: Así impactó la pandemia en la globalización.
Theme
This paper is the latest update of previous analyses of the impact of the pandemic on globalisation, seen through the results of the Elcano Global Presence Index.
Summary
The magnitude of the pandemic has led to a proliferation of analyses of its potential impact on international relations and the globalisation process. In previous publications we have used the Elcano Global Presence Index to contribute to the debate, using estimates of the behaviour of its components. Thus, we made a first estimate in the spring of 2020, which we updated during the autumn of that year and, again, in the spring of 2021. We are now updating our analysis anew, on the basis of data that in several cases are more precise than those used in previous publications, since they are now being replaced by observations from the Index’s sources.
This last analysis of the series follows a similar structure to the previous ones. After presenting some methodological considerations, we address the behaviour of the Index variables in their economic, military and soft dimensions.
The results confirm our previous work: a de-globalisation is observed coinciding with the pandemic, particularly in its economic dimension, consolidating or accelerating the trend of recent years towards a softer globalisation. The impact is also greater than predicted, due to several variables behaving differently than expected, particularly the military and soft dimensions.
It remains to be seen how much of this behaviour is cyclical in the face of the pandemic and how much will become structural features of a new stage of globalisation, which will be observed in future editions of the Elcano Global Presence Index.
Analysis
Since the World Health Organisation (WHO) declared the pandemic in March 2020, the Elcano Royal Institute has devoted much of its activity to analysing the effects of the pandemic on various aspects of international relations and global affairs. Among these is the effect on globalisation, seen from both the angle of its governance and also in reference to the speed and nature of the phenomenon.
For the latter, we have used, among other tools, the Elcano Global Presence Index. By including the external projection of 140 countries in the economic, military and soft dimensions, its aggregation could be considered to capture the speed and nature (in permanent transformation) of the globalisation process (Figure 1). Thus, as early as April 2020 we dared to anticipate what the effect of the pandemic could be on each of the 16 variables of the Index. We wanted to work out how the health crisis might end up affecting a process of internationalisation, already faltering since the years before the pandemic, and undergoing a profound transformation towards a less economic, softer and, above all, more technological and digital nature.
This last analysis in the series follows a similar structure to the previous ones. The following section contains some methodological considerations and then reviews, in sections 2 to 4, the behaviour of the variables of the Index in its economic, military and soft dimensions.
(1) Looking at the pandemic and globalisation from the perspective of the Elcano Global Presence Index
For that first analysis, the absence of previous similar statistically-documented episodes led us to predict the behaviour of the variables of the Index by drawing parallels with the Great Recession, over 10 years ago. We also drew different scenarios, more or less pessimistic, about the depth of the looming crisis.
However, various international organisations such as the United Nations Conference on Trade and Development (UNCTAD), the World Tourism Organisation (UNWTO), the World Trade Organisation (WTO) and the Organisation for Economic Cooperation and Development (OECD) reacted quickly, making an unprecedented statistical and communication effort that made it possible to generate statistics (forecasts or even near real-time observations) in record time, on the very diverse effects that the pandemic could have.
Thus, in a second and third analysis, published in autumn 2020 and spring 2021, we were able to replace, to a large extent, our own forecasts with those of the usual sources of the Elcano Global Presence Index, or with those of parallel variables that could serve as proxies.
Already in this third analysis, several of the sources of the indicators that make up the Index had managed to capture the behaviour of the indicators in the year 2020. This is the case, for example, of the OECD, which in April 2021 published provisional data on official development assistance (ODA) that, by the way, contradicted all forecasts that predicted a slump in the OECD’s solidarity effort (at a time of tough social and economic adjustments in these economies). OECD figures pointed to a new historical record for aid from the so-called traditional donors.
With this fourth and final analysis we close the series with which we sought to anticipate the effects of the pandemic on (de)globalisation. We do so for two reasons. First, as will be seen in the following sections, almost all of the indicators that make up the Elcano Global Presence Index already have records for 2020. That is, we already know what the effect of the pandemic has been on globalisation (which incidentally allows us to eliminate the three scenarios of previous publications). Secondly, the Index takes about two years to incorporate global transformations. In 2022 we will be publishing the 2021 edition, which will be constructed with data observed for 2020 for most variables. In short, the next edition of the Index will already incorporate the effects of the pandemic in the calculation of globalisation, but also in that of the external projection of each of the 150 countries for which it will be calculated.
It could be argued that the pandemic is far from over for much of the world’s population. While the incidence of the disease has been relatively evenly distributed between the North and the global South, vaccination has not. At the time of writing this paper, according to data compiled by Our World in Data, almost 240 million cases have been confirmed worldwide, while fewer than 34 million people have been vaccinated, and these are concentrated in Europe and North America.
However, it is equally true that these two regions, together with Asia and the Pacific –which, even with lower vaccine penetration, would by 2021 be recovering levels of activity comparable to 2019 in a large part of the region– account for more than 80% of global exchanges. In short, the reason why the behaviour of the Elcano Global Presence Index variables in 2020 could be a good proxy for globalisation is because global activity is concentrated in the same regions where the effort to fight the pandemic has also been concentrated.
Finally, in terms of the methodological aspects of this exercise, the effect of the pandemic (measured in annual variations) is applied here to the 2020 Index values, which reflect the global reality of 2019. Thus, for the first time, we are able to capture the pre-pandemic reality at the time immediately prior to the outbreak of the pandemic.
(2) Economic dimension
Recently, UNCTAD, the source for the calculation of the economic dimension, has updated trade data by commodity for 2020. We know how the energy, primary goods, manufacturing and services variables behaved in the pandemic year, with respect to the previous year, without the need to resort to estimates.Figure 2. Exports of goods and services (US mn)
| 2019 | 2020 | Var 2019-20 (%) | |
|---|---|---|---|
| Energy (SITC 3) | 2.250.343 | 1.497.180 | -33,5 |
| Primary goods (SITC 0+1+2+4+68+667+971) | 2.999.902 | 3.067.298 | 2,2 |
| Manufactures (SITC 5 to 8 minus 667 and 68) | 12.936.713 | 12.381.411 | -4,3 |
| Services | 6.226.802 | 4.984.187 | -20,0 |
Source: UNCATD.Stat (accessed 8/10/2021).
Trade in services fell by 20% between 2019 and 2020, thus more than what the same agency estimated earlier this year. At that time, the forecast was for a 16.5% decline, which is the figure incorporated in the previous analysis of this series of publications.
As noted above, the pandemic has not hit all sectors of production and trade equally: while there has been a notable fall in the automobile trade, pharmaceutical production and exports have grown significantly. The final result is very similar to the forecasts we made last spring: a fall of more than 4% in manufacturing trade, the resilience of primary goods (+2.2%) and a slump in energy trade (-33.5) in a context of low energy prices, paralysis in the transport of goods and people and significant stoppages in some sectors of manufacturing production (Figure 2).
With regard to the latter category of goods, a very notable increase can also be expected in 2021, given the behaviour of energy prices in the second half of this year.
UNCTAD has not yet updated to 2020 the information on the stock of foreign direct investment (FDI) abroad, the indicator we use to calculate the investment variable. We therefore maintain the same data that we included in last spring’s publication, data that we calculate on the basis of the behaviour of FDI flows in 2020 since these have already been published by the source.1 Global FDI flows fell by 42% in 2020, from US$1.5 trillion to an estimated US$859 billion the following year. In order to extend this variation to the stock variable, we choose to estimate it on the basis of the stock-flow ratio in the most recent year. In 2019 a 33.9% increase in flows meant a 9.7% increase in stock. We therefore assume that a 42% drop in flows in 2020 results in a 12.3% decrease in stock that same year.
(3) Military dimension
The military dimension of the Elcano Global Presence Index is made up of the variables of troops deployed abroad and military capabilities. The source used for both indicators is the Military Balance, published annually by the IISS, and whose 2021 edition, with data for 2020, is now available. It has therefore been possible to calculate the external military projection of the 150 countries that will make up the next edition of the Index, the aggregate of which would show the evolution of globalisation in its military facet.2 We thus replace the estimates of previous analyses with actual observations.
The aggregate military projection has fallen by 4.3% in 2020, compared with the previous year, which is explained by a very sharp drop in the sum of troops, of all origins, deployed in foreign bases or on international missions (meaning a decrease of the variable of deployed troops of 10.4%) and almost identical military capabilities for international deployment3 (with a variable decreasing by 0.6%).
The actual behaviour of both variables has, in this case, been different from what was predicted in previous publications.
On the one hand, with respect to deployed troops, the drop in global activity at almost all levels led us to predict, on the basis of analyses by the IISS itself, 4 the freezing of strategic decisions on possible deployments or redeployments. However, at the end of the year, there was a substantial repatriation of troops in the face of the collapse of military operations.
On the other hand, although defence budget commitments have risen considerably in the EU and NATO5 contexts, this increased strategic investment has not yet materialised in a significant change in capabilities; something that can also be explained in the context of a drop in productive activity.
(4) The soft dimension
(4.1) Migration
At the beginning of the year the United Nations Population Division published the figure for the world’s immigrant population stock, that was included in the previous publication in this series. There were 280 million immigrants in the world in mid-2020, a 13.2% rise compared with 2015 and up 2.6% in respect to the previous year, if we assume a linear behaviour of the variable (in coherence with the calculation method applied in the annual updates of the Index).
(4.2) Tourism
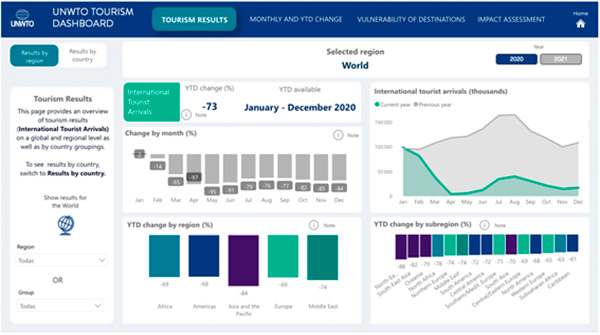
The World Tourism Organisation (UNWTO) has, since the beginning of the pandemic, monitored international tourism movements almost in real time, which has made it possible to incorporate observed, rather than estimated, data into our analysis at all times.
For this reason, as soon as the spring, we already knew the deep impact of the health crisis on this variable of the Elcano Global Presence Index. A few months later, the UNWTO corrected the record slightly upwards, placing it at a 73% drop in international tourist arrivals (to any global destination) in 2020 compared with 2019 (Figure 3).
(4.3) Sports
The sports variable of the Elcano Global Presence Index captures the performance of clubs and men’s and women’s football teams (via FIFA points) as well as the Olympic medal tally.
The Tokyo Olympics were finally held in 2021, so their results are not considered in the performance of the variables in 2020. Thus, the sports indicator is explained by what happens in football competitions, more specifically by the FIFA points of men’s and women’s senior national teams (FIFA) and by the points of football clubs (IFFHS). After the absolute standstill in the first months of the pandemic, the subsequent recovery of football competitions (often without an audience) has been uneven across countries and regional confederations. Thus, in aggregate terms, in 2020 there is a decrease of 1.4% in the sports indicator compared with 2019.
As with the military dimension, the change in the observed figure is far from previous estimates, which were made on the basis of information on cancellations of sport events. In this case, what turns out to be a much more moderate drop (in our previous publication we expected a drop of more than 50%) leads to a correction in the final figure for soft deglobalisation.
(4.4) Culture
As seen in section 2, disaggregated data on international trade for 2020 are now available, and it is precisely these data (specifically those relating to exports of cultural goods and services) that define the culture variable of the Elcano Global Presence Index.
In line with what occurred in international trade, there has been a substantial fall in this type of global exchanges. Exports of audiovisual services fell by more than 15% in 2020, from US$50,422 million in 2019 to US$42,776 million in 2020, behaving differently than expected –given the increase in digital cultural consumption during the various periods of confinement–.
The behaviour of trade in cultural goods is perhaps more intuitive, as it fell by more than 24% in the pandemic year (from US$207,869 million in 2019 to US$157,638 million in 2020), bringing cultural deglobalisation to 19.7%.6
(4.5) Information
The information indicator of the Elcano Global Presence Index is made up of two components: the Internet bandwidth installed in each country according to the database of the International Telecommunications Union (ITU) and the number of news mentions by the main international agencies (Associated Press, Reuters, AFP, DPA, ITAR-TASS, EFE, ANSA and Xinhua) collected in the Factiva database.
We consider the first component, bandwidth, to be stable, given that the database used in its 2020 version offers data up to 2019. For the second component we record an aggregate 10% drop in 2020 compared with the previous year. Given that each component weighs 50% in the aggregate information variable, we consider a 5% drop of this indicator.
In previous publications we considered different scenarios for the possible evolution of aggregate information presence, ranging from a possible fall of 1.4% to an increase of 17%. It should be borne in mind that this aggregate fall comes hand in hand with a significant increase in the media presence for those countries that experienced the first impact of the pandemic –for example, mentions of China and Italy increased by 4.7%, while Spain’s increased by 9.3%–.
(4.6) Technology
Last spring we already had data on the number of applications of foreign-oriented patents in 2020, according to the World Intellectual Property Organisation (WIPO), which is the source used by the Elcano Global Presence Index for one of the indicators of the technology variable. These grew by 4% between 2019 and 2020.7
As for the second component of this variable, intellectual property income, data for 2020 are already available from the International Monetary Fund. Here too, the actual performance has been somewhat different from what we predicted (assuming a parallel trend of the two components). Revenues fell by 2.5% in the year of the pandemic, from US$394,957 million in 2019 to US$385,091 million the following year.
(4.7) Science
Data on presence through science for 2020 were already available in spring. The Elcano Global Presence Index measures the scientific projection of countries with the number of articles, notes and reviews published annually in the fields of the arts and humanities, social sciences and sciences, collected in the Web of Science (WOS) of Clarivate Analytics. This information, provided by the Spanish Federation of Science and Technology (FECYT) and accessed on 22 March 2021, shows a growth in global scientific production between 2019 and 2020 of 27.2% (from 2,045,836 results to 2,601,725).8
(4.8) Education
Also in the case of education, measured in the Index by the number of foreign students enrolled annually in tertiary education, our source has already published data for 2020. Thus, according to UNESCO, these students increased from 5.91 million in 2019 to 5.94 million in 2020. That is, despite the pandemic and restrictions on the international movement of people, enrolment was affected by only 0.7%, a figure much lower than we expected in previous publications, given early analyses by UNESCO itself or by BridgEU.
It can be assumed that the change from face-to-face to online teaching in many university degrees has been able to strongly contain the fall in enrolments. However, the figure shows a drastic change of trend in an indicator that recorded increases of between 4% and 8% in the years prior to the health crisis.
(4.9) Development cooperation
In April of this year the OECD9 published provisional 2020 figures of official development assistance (ODA) provided by the so-called traditional donors, showing, contrary to Development Initiatives’ forecasts, an increase in total aid of 3.5% and a new historical record in the effort for international solidarity, in a year of practically unprecedented crisis.
More recently, these figures have been updated. According to the OECD, gross ODA disbursed in 2020 by Development Assistance Committee (DAC)-OECD donors and by some non-members10 amounted to US$188,447 million, up 5.4% from the previous year, when aid stood at US$178,859 million. The increase can be explained by the greater budgetary effort of traditional donors, particularly EU members, as opposed to emerging donors, which are actually decreasing their aid in 2020.
Conclusions
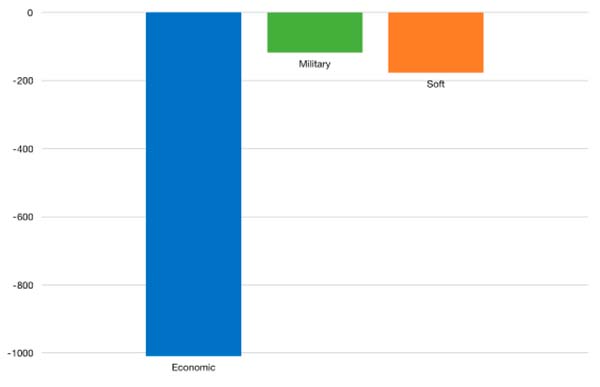
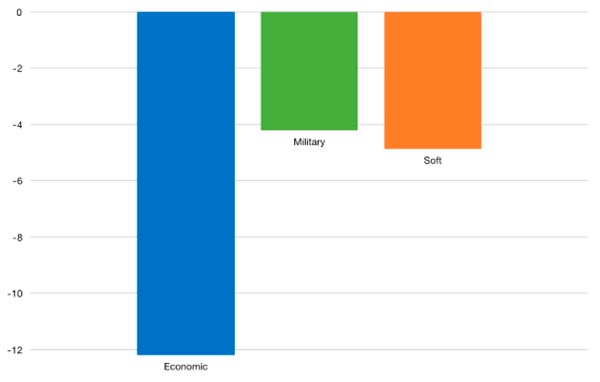
The pandemic has probably had a de-globalising effect insofar as the aggregate value of the components of the Elcano Global Presence Index in 2020 is 8.9% lower than the same indicator for the previous year. Deglobalisation is occurring at all three levels: economic, military and soft. However, its intensity is much greater in the economic dimension, which decreases by 12.2%, than in the military (-4.2%) or the soft dimension (-4.9%) (Figures 4 to 6).Figure 4. Behaviour of the Elcano Global Presence Index variables in 2019 and 2020 (annual variation, in %, all other values in index value)
| Variation (%) | 2019 value | 2020 forecast | |
|---|---|---|---|
| Energy | -33,5 | 356,8 | -119,4 |
| Primary goods | 2,2 | 560,4 | 12,6 |
| Manufactures | -4,3 | 1.808,5 | -77,6 |
| Services | -20,0 | 1.852,7 | -369,7 |
| Investments | -12,3 | 3.697,8 | -454,9 |
| Troops | -10,4 | 1.033,6 | -107,5 |
| Military equipment | -0,6 | 1.768,2 | -10,6 |
| Migrations | 2,6 | 281,4 | 7,3 |
| Tourism | -73,0 | 287,6 | -209,9 |
| Sports | -1,4 | 156,8 | -2,2 |
| Culture | -19,7 | 588,7 | -116,0 |
| Information | -5,0 | 311,2 | -15,6 |
| Technology | 0,8 | 755,8 | 5,7 |
| Science | 27,2 | 471,8 | 128,2 |
| Education | 0,7 | 362,5 | 2,5 |
| Development cooperation | 5,4 | 417,5 | 22,5 |
| Economic | -12,7 | 8.276,2 | -1.009,1 |
| Military | -4,3 | 2.801,8 | -118,1 |
| Soft | -4,9 | 3.633,3 | -177,4 |
| Global | -8,9 | 14.711,3 | -1.304,6 |
Source: the authors.
This analysis thus confirms the previous analyses of this series in two respects. On the one hand, in that there is a strong deglobalisation, even greater than what we considered in the most pessimistic scenario in our first analysis. On the other hand, this analysis also confirms a greater economic deglobalisation, as opposed to military or soft, which is a trend we had already observed in the years prior to the pandemic.
As pointed out, the de-globalising effect could be greater than expected in the previous analysis (from spring this year). This is due to the very different behaviour of the military dimension, which we expected to be more resilient, given the increase in military budget allocations, as well as by the different results in the field of culture, a realm in which exchanges strongly diminished despite the increase in the consumption of digital cultural services.
Many of these trends will be circumstantial and associated with the worst months of the pandemic, as they are already being corrected in 2021. This is the case, at least partially, for economic variables. According to UNCTAD, trade in goods and services would have increased by 4% in the first quarter of 2021.11
However, it is likely that other variables will acquire a new behaviour derived from the pandemic. This, added to the previous trend towards a less economic and softer globalisation, will shape new features of the globalisation process, both in its features and its leaders.
Iliana Olivié
Senior Analyst at the Elcano Royal Institute and Coordinator of the Elcano Global Presence Index Project | @iolivie
Manuel Gracia
Analyst on the Elcano Global Presence Index project | @mgraciasn
1 UNCTAD (2021), ‘Global FDI flows down 42% in 2020’, Investment Trends Monitor, nº 38, United Nations Conference for Trade and Development, January.
2 The authors are extremely grateful to Félix Arteaga, who updates this calculation every year.
3 Aircraft carriers, frigates, cruisers, destroyers, nuclear-powered submarines, amphibious projection ships, medium and heavy strategic transport aircraft, and tanker aircraft. The value of the presence in military equipment is the result of the weighted sum of the different types of equipment considered in the international troop projection. The weighting coefficient of each type of equipment is the result of the calculation of equivalences between the military equipment existing in the world in 2010 as a reference year.
4 IISS (2021), ‘Editor’s introduction to the Military Balance 2021’, The Military Balance 2021, International Institute for Strategic Studies, February.
5 NATO (2021), ‘Defence Expenditures of NATO Countries (2013-2020)’, Press Release, North Atlantic Treaty Organization, 16/III/2021.
6 It should be noted that the annual variation in exports of cultural goods is that of the top 10 goods by trade volume according to UN Comtrade data. These account for 88.5% of all goods exported in 2020 and therefore their behaviour can be extrapolated to that of all goods in this category. For more on this see Ángel Badillo (2020), ‘La cultura en el “poder suave”: una revisión metodológica del Índice Elcano de Presencia Global’, Documento de Trabajo, nr 21/2020,Elcano Royal Institute, 11/VI/2020.
7 WIPO (2021), ‘Innovation perseveres: international patent filings via WIPO continued to grow in 2020 despite COVID-19 pandemic’, PR/2021/874, World Intellectual Property Organisation, March.
8 The authors thank the FECYT Research Department for providing these data.
9 OECD (2021), ‘COVID-19 spending helped to lift foreign aid to an all-time high in 2020 but more effort needed’, Press Release, Organisation for Economic Cooperation and Development, April.
10 Bulgaria, Croatia, Cyprus, Estonia, Israel, Latvia, Liechtenstein, Lithuania, Malta, Qatar, Romania, Saudi Arabia, Taiwan, Turkey and the United Arab Emirates.
11 UNCTAD (2021), ‘World trade rebounds to record high in Q1 2021’, Global Trade Update, United Nations Conference on Trade and Development, May.